Fig. 5
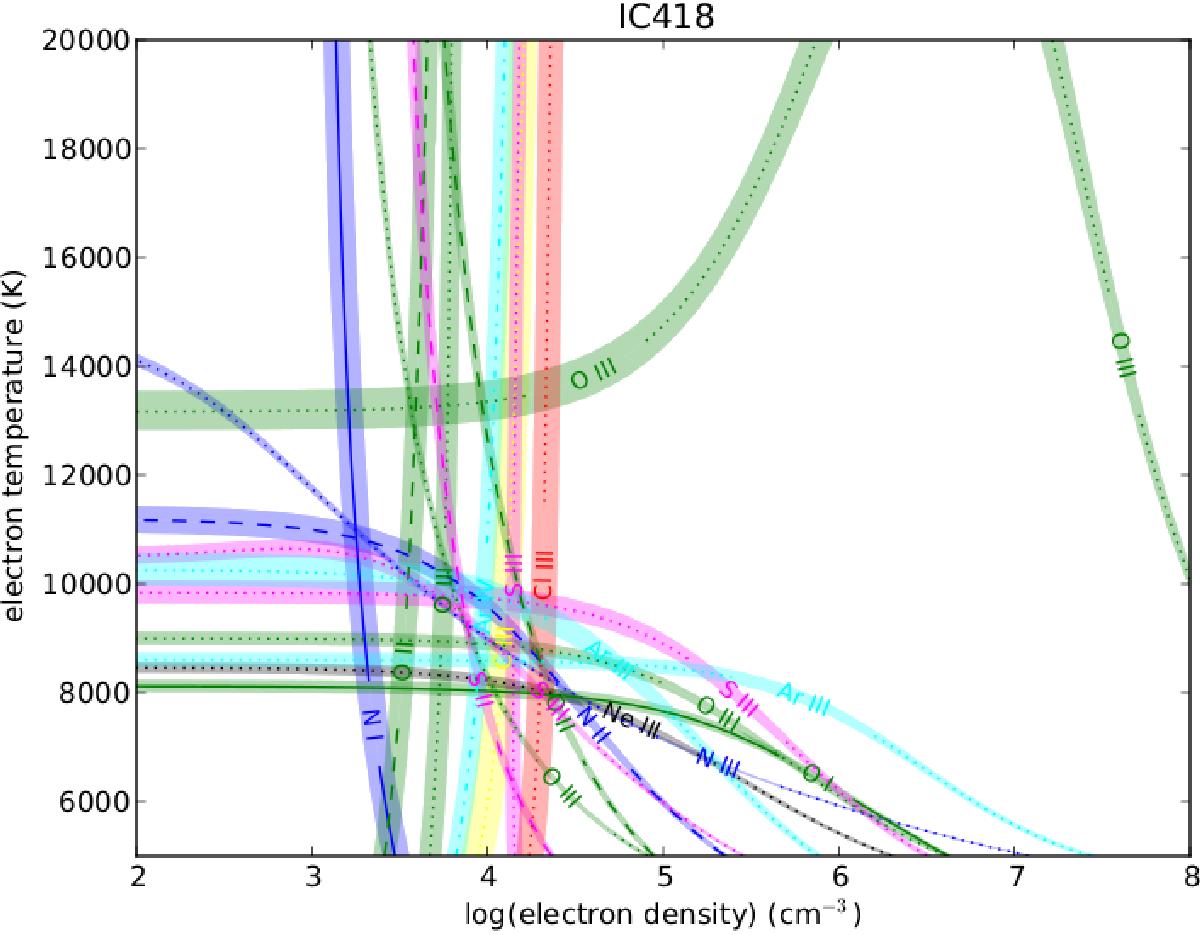
Emission-line diagnostic plot of the planetary nebula IC 418. Each band represents the Ne,Te locus consistent with the observed ratio and its uncertainty. The observational data have been taken from the compilation in Morisset & Georgiev (2009) and an analysis of the object is given in Escalante et al. (2012). A sample script that produces this kind of diagnostic plots is given in the Appendix.
Current usage metrics show cumulative count of Article Views (full-text article views including HTML views, PDF and ePub downloads, according to the available data) and Abstracts Views on Vision4Press platform.
Data correspond to usage on the plateform after 2015. The current usage metrics is available 48-96 hours after online publication and is updated daily on week days.
Initial download of the metrics may take a while.