Fig. 3
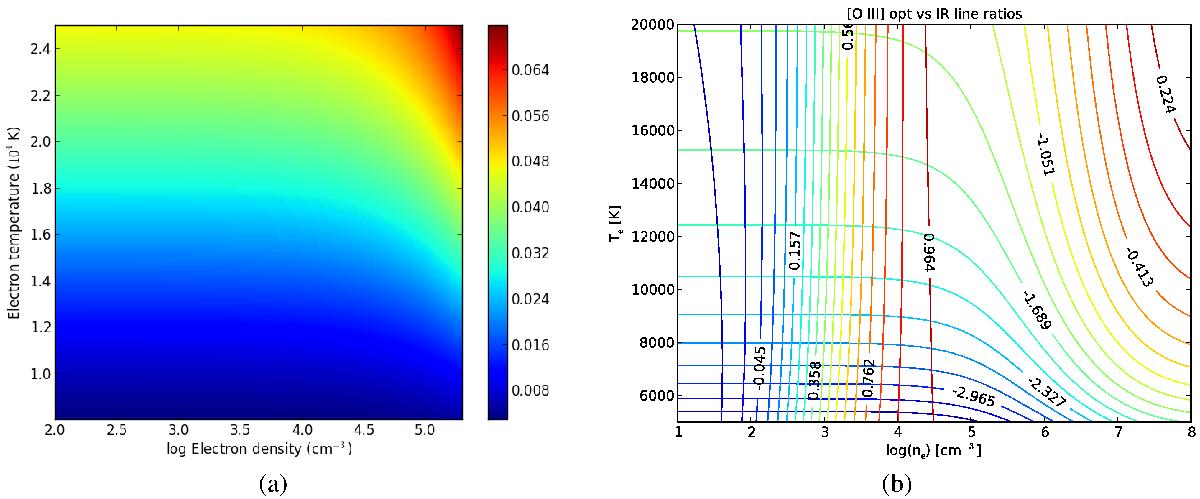
Left: map of the [O iii] λ4363/λ5007 intensity ratio as a function of electron density and temperature, obtained with the plotImage() command. Right: theoretical contour plot for the simultaneous determination of Te and Ne with the [O iii] λλ4959,5007/λ4363 (mainly horizontal curves) and [O iii] λ52μ/λ88μ (vertical curves) intensity ratios as a function of electronic density and temperature, obtained with the plotContours() command. The levels are numbered with the log of the ratio.
Current usage metrics show cumulative count of Article Views (full-text article views including HTML views, PDF and ePub downloads, according to the available data) and Abstracts Views on Vision4Press platform.
Data correspond to usage on the plateform after 2015. The current usage metrics is available 48-96 hours after online publication and is updated daily on week days.
Initial download of the metrics may take a while.