Fig. 2
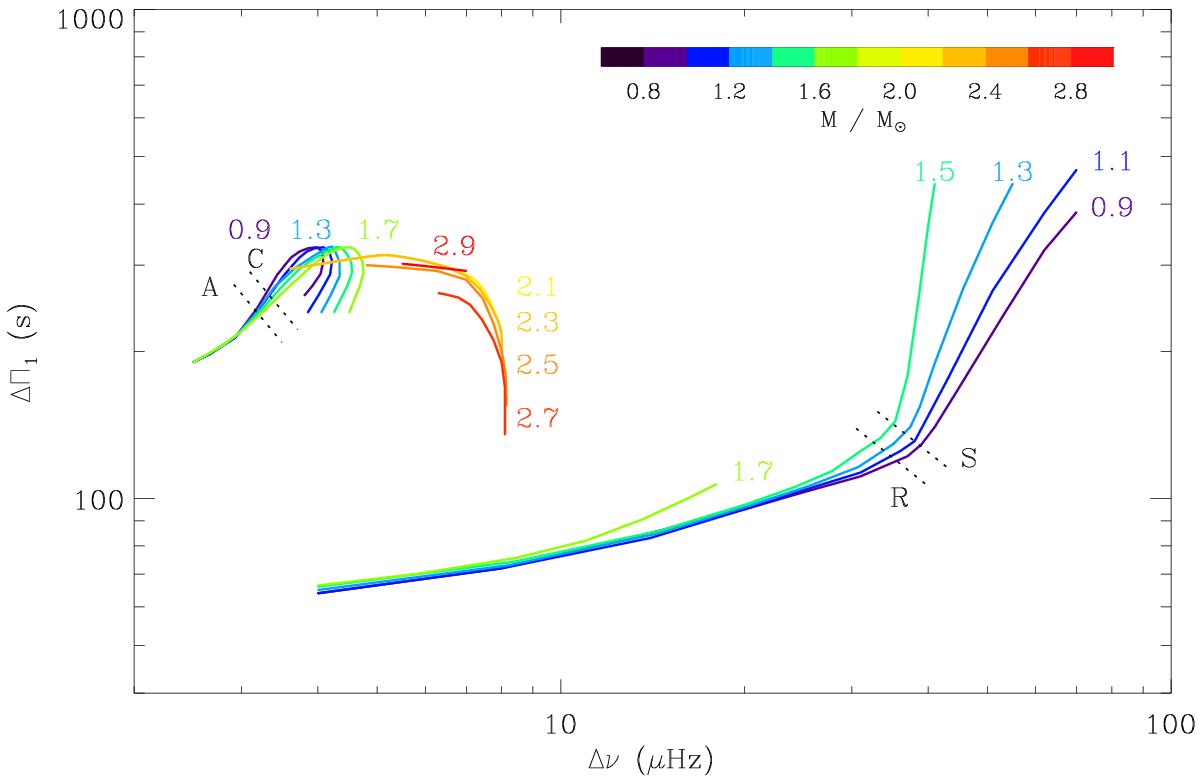
Evolutionary tracks reconstructed from the seismic observations for stellar masses in the [ 0.9−2.9 M⊙] range. The 1.9 M⊙ track is not shown because more information is needed to define the limit between the clump and secondary-clump stars. On the RGB, the dispersion due to the first luminosity bump is too high to allow an unambiguous definition of the evolutionary tracks for stellar masses above 1.9 M⊙. Dotted lines indicates the boundaries between evolutionary stages.
Current usage metrics show cumulative count of Article Views (full-text article views including HTML views, PDF and ePub downloads, according to the available data) and Abstracts Views on Vision4Press platform.
Data correspond to usage on the plateform after 2015. The current usage metrics is available 48-96 hours after online publication and is updated daily on week days.
Initial download of the metrics may take a while.