Fig. 1
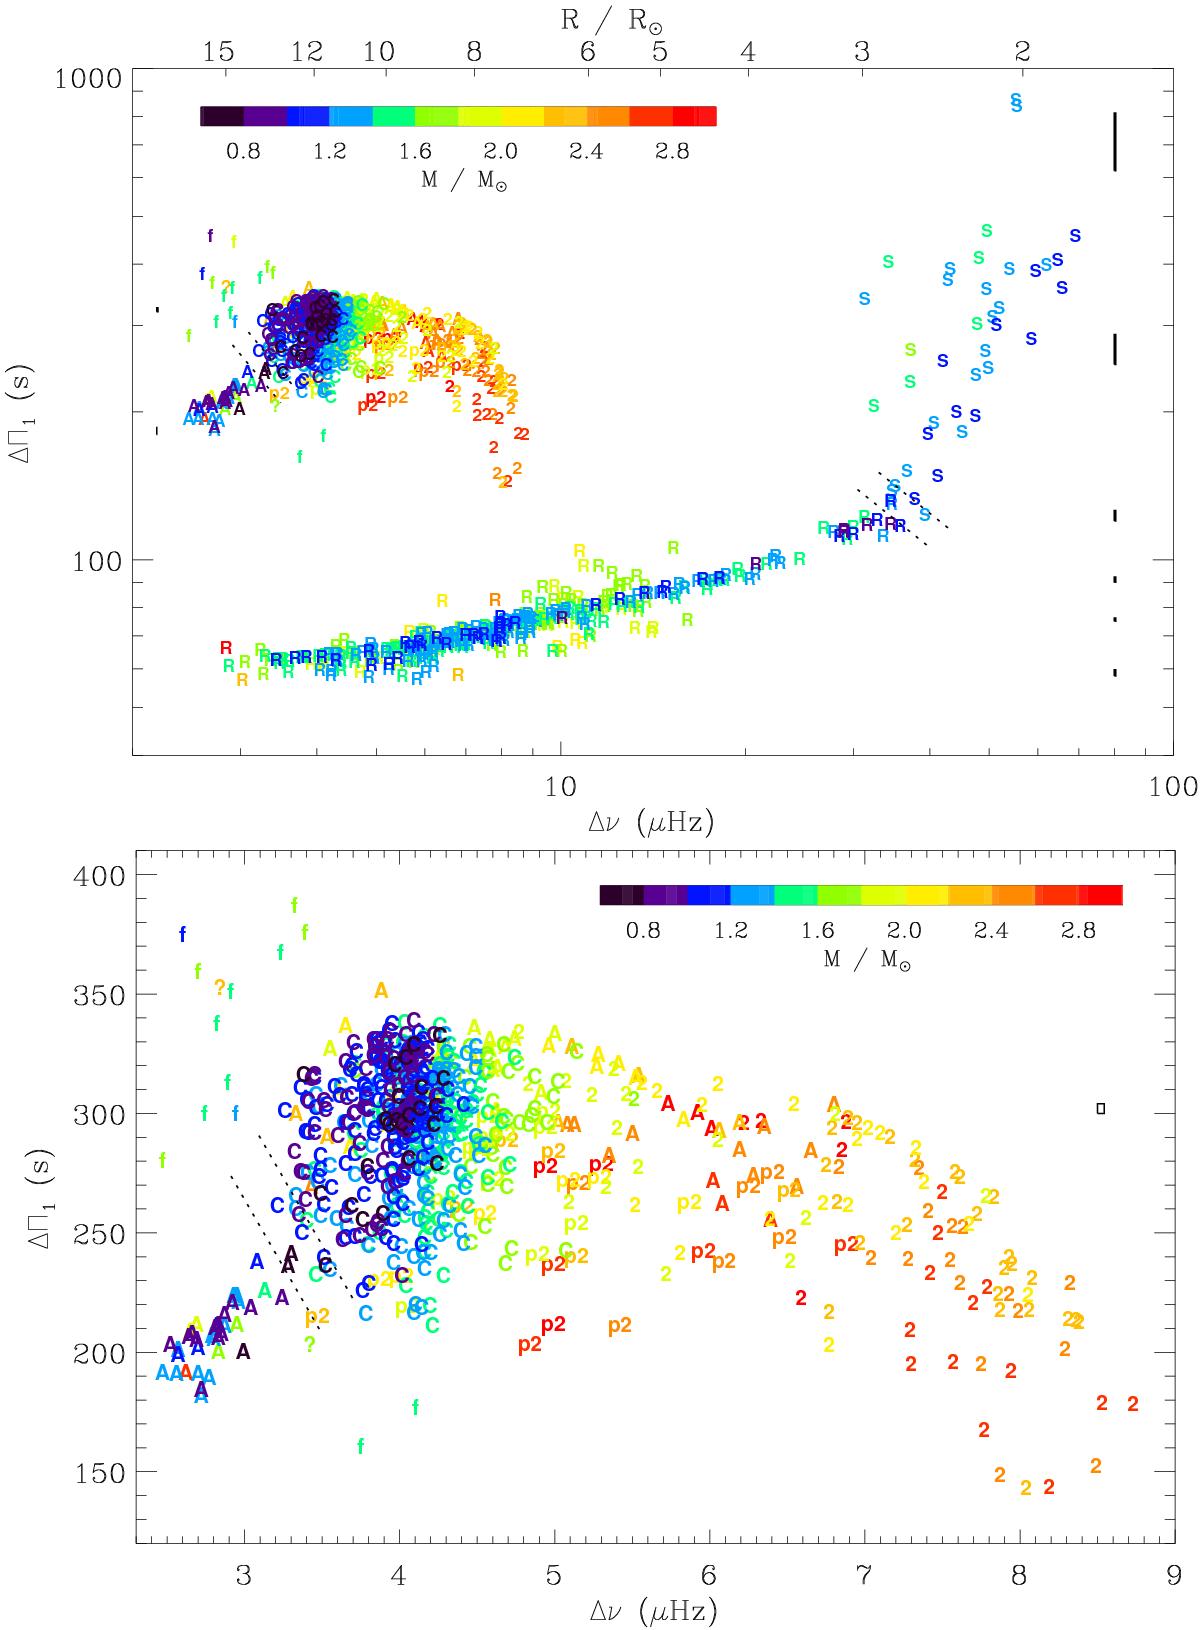
Period spacing as a function of the frequency spacing Δν. Top: the seismic proxy for the stellar mass is indicated by the color code. The evolutionary states are indicated by S (subgiants), R (RGB), f (helium subflash stage), C (red clump), p2 (pre secondary clump), 2 (secondary clump), and A (stars leaving the red clump moving toward the AGB). The error boxes on the right side indicate the mean uncertainties, as a function of , for stars on the RGB; for clump stars, uncertainties are indicated on the left side. Dotted lines indicate the boundaries between evolutionary stages. Bottom: zoom in the red-clump region. Data used in this figure are available at the CDS.
Current usage metrics show cumulative count of Article Views (full-text article views including HTML views, PDF and ePub downloads, according to the available data) and Abstracts Views on Vision4Press platform.
Data correspond to usage on the plateform after 2015. The current usage metrics is available 48-96 hours after online publication and is updated daily on week days.
Initial download of the metrics may take a while.