Fig. 8
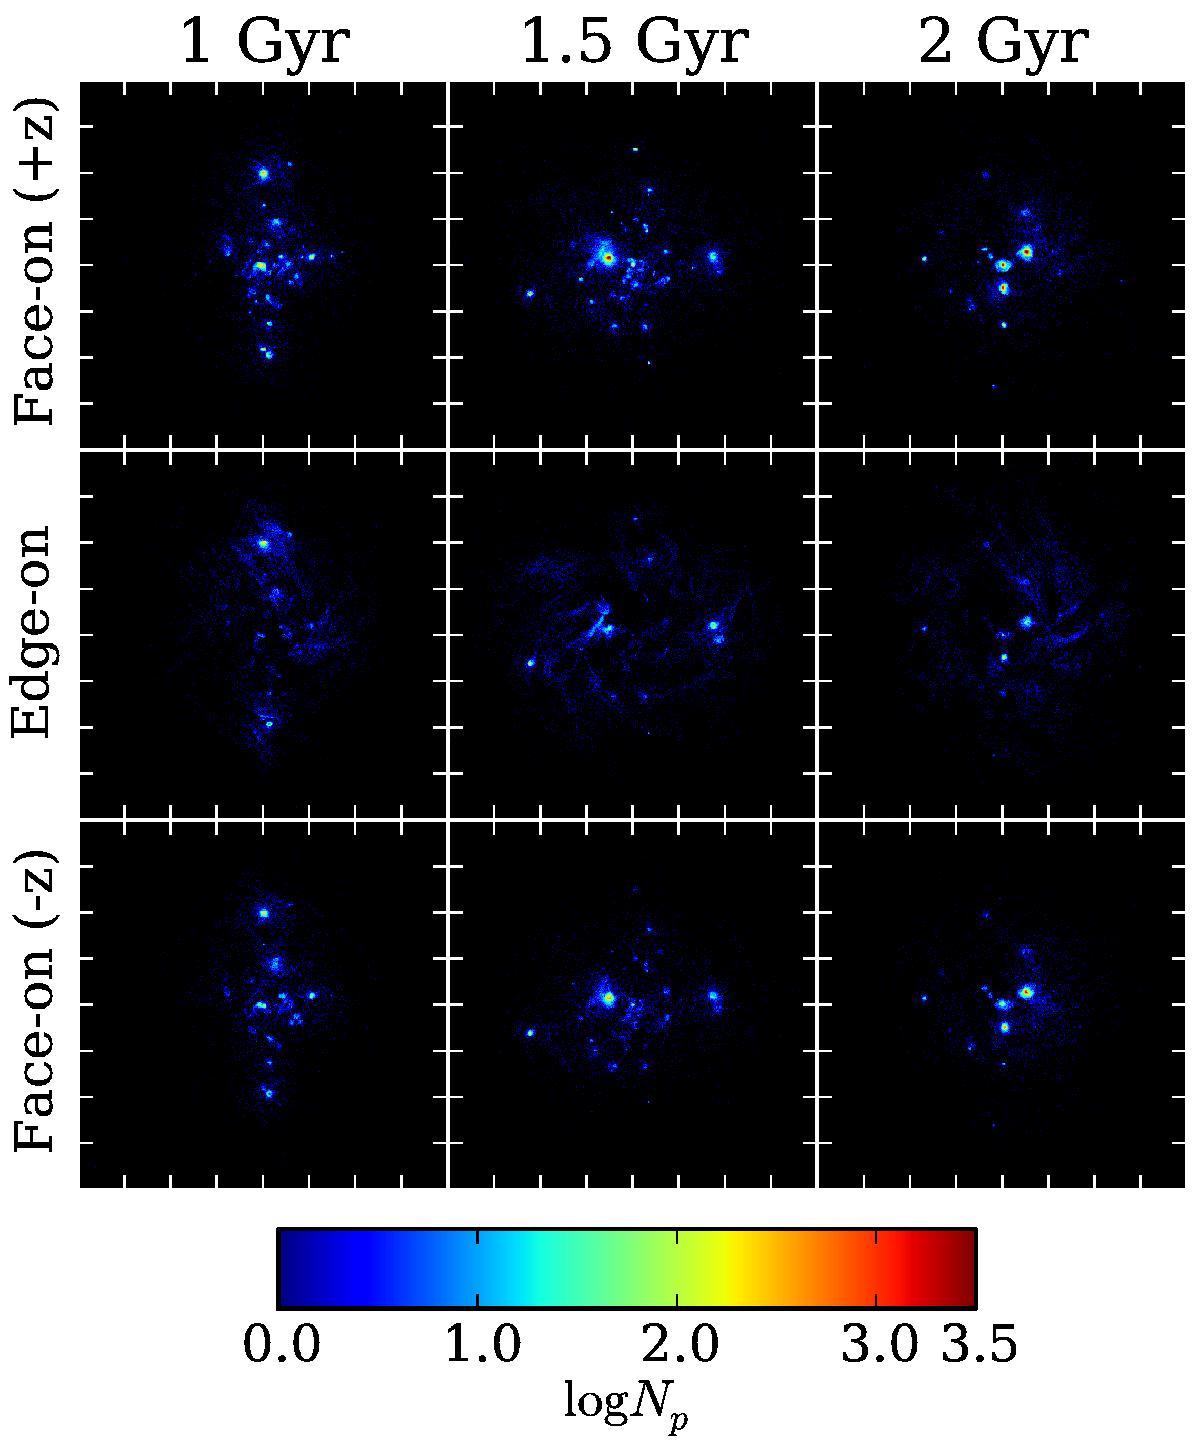
Spatial distribution of transmitted Lyα photons for the snapshots at 1/1.5/2 Gyr (left to right). In contrast to Fig. 5, we show only the photons that escaped face-on toward the positive z-axis (top), edge-on (middle), and face-on toward the negative z-axis (bottom). Photons within a range of ±10° of the principal direction were considered. Shown are the central 40 kpc of the disk.
Current usage metrics show cumulative count of Article Views (full-text article views including HTML views, PDF and ePub downloads, according to the available data) and Abstracts Views on Vision4Press platform.
Data correspond to usage on the plateform after 2015. The current usage metrics is available 48-96 hours after online publication and is updated daily on week days.
Initial download of the metrics may take a while.