Fig. 6
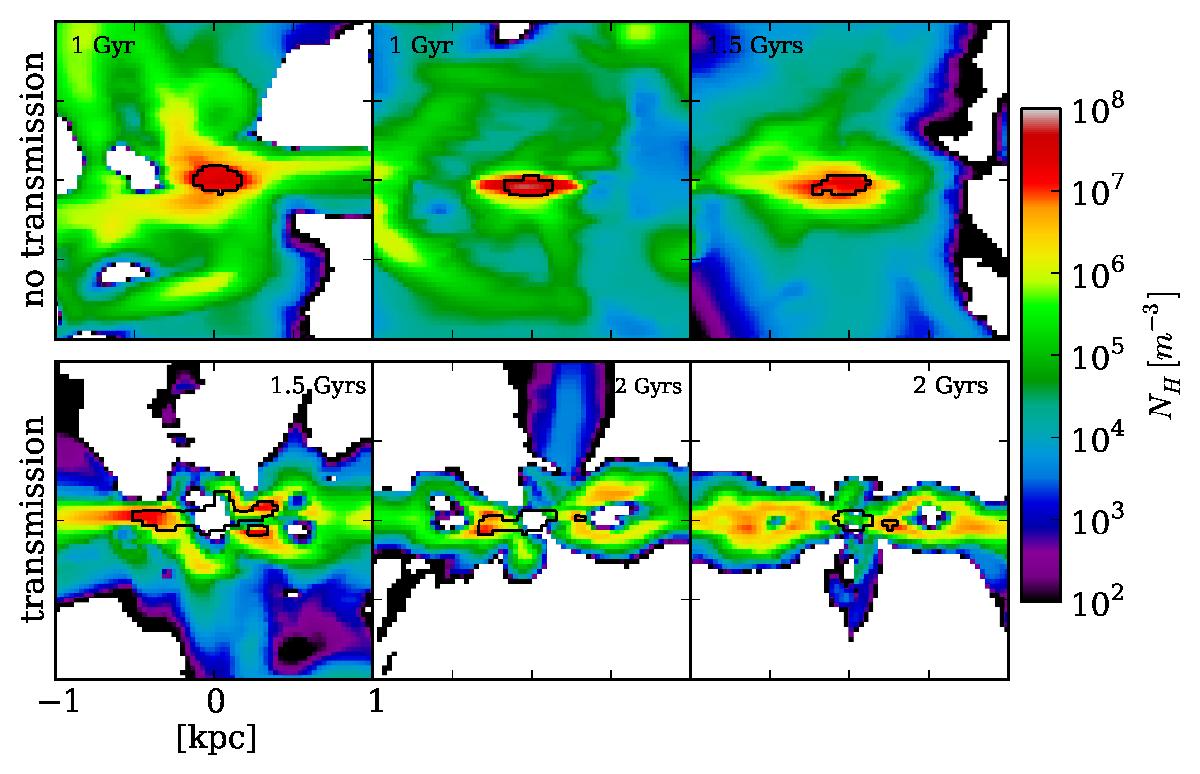
Examples for density slices through the disk at the location of various emission spots. The disk lies along the x-axis in the plots. Top row: examples for spots that do not exhibit significant transmission. Bottom row: spots that show transmission. The black contours indicate the approximate center of emission in each slice.
Current usage metrics show cumulative count of Article Views (full-text article views including HTML views, PDF and ePub downloads, according to the available data) and Abstracts Views on Vision4Press platform.
Data correspond to usage on the plateform after 2015. The current usage metrics is available 48-96 hours after online publication and is updated daily on week days.
Initial download of the metrics may take a while.