Fig. 5
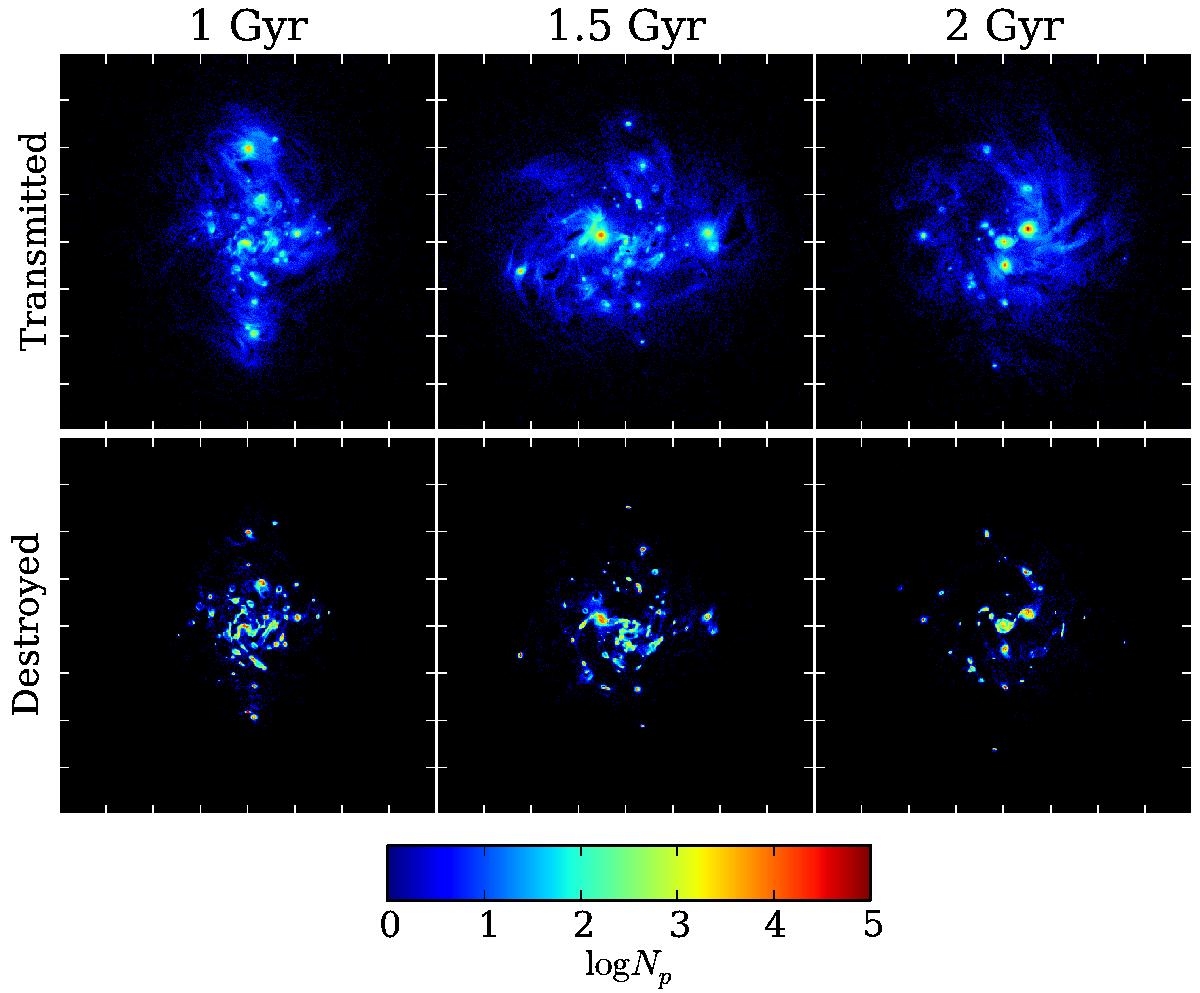
Spatial distribution of escaping photons (top) and absorbed photons (bottom) for the snapshot at 1/1.5/2 Gyr (left/center/right). For the transmitted photons, the distribution is given by the points in the simulation box where photons scattered just before it left the box. For the destroyed Lyα photons, we binned the positions at which photons were absorbed. Each plot shows the central 40 kpc of the disk.
Current usage metrics show cumulative count of Article Views (full-text article views including HTML views, PDF and ePub downloads, according to the available data) and Abstracts Views on Vision4Press platform.
Data correspond to usage on the plateform after 2015. The current usage metrics is available 48-96 hours after online publication and is updated daily on week days.
Initial download of the metrics may take a while.