Fig. 2
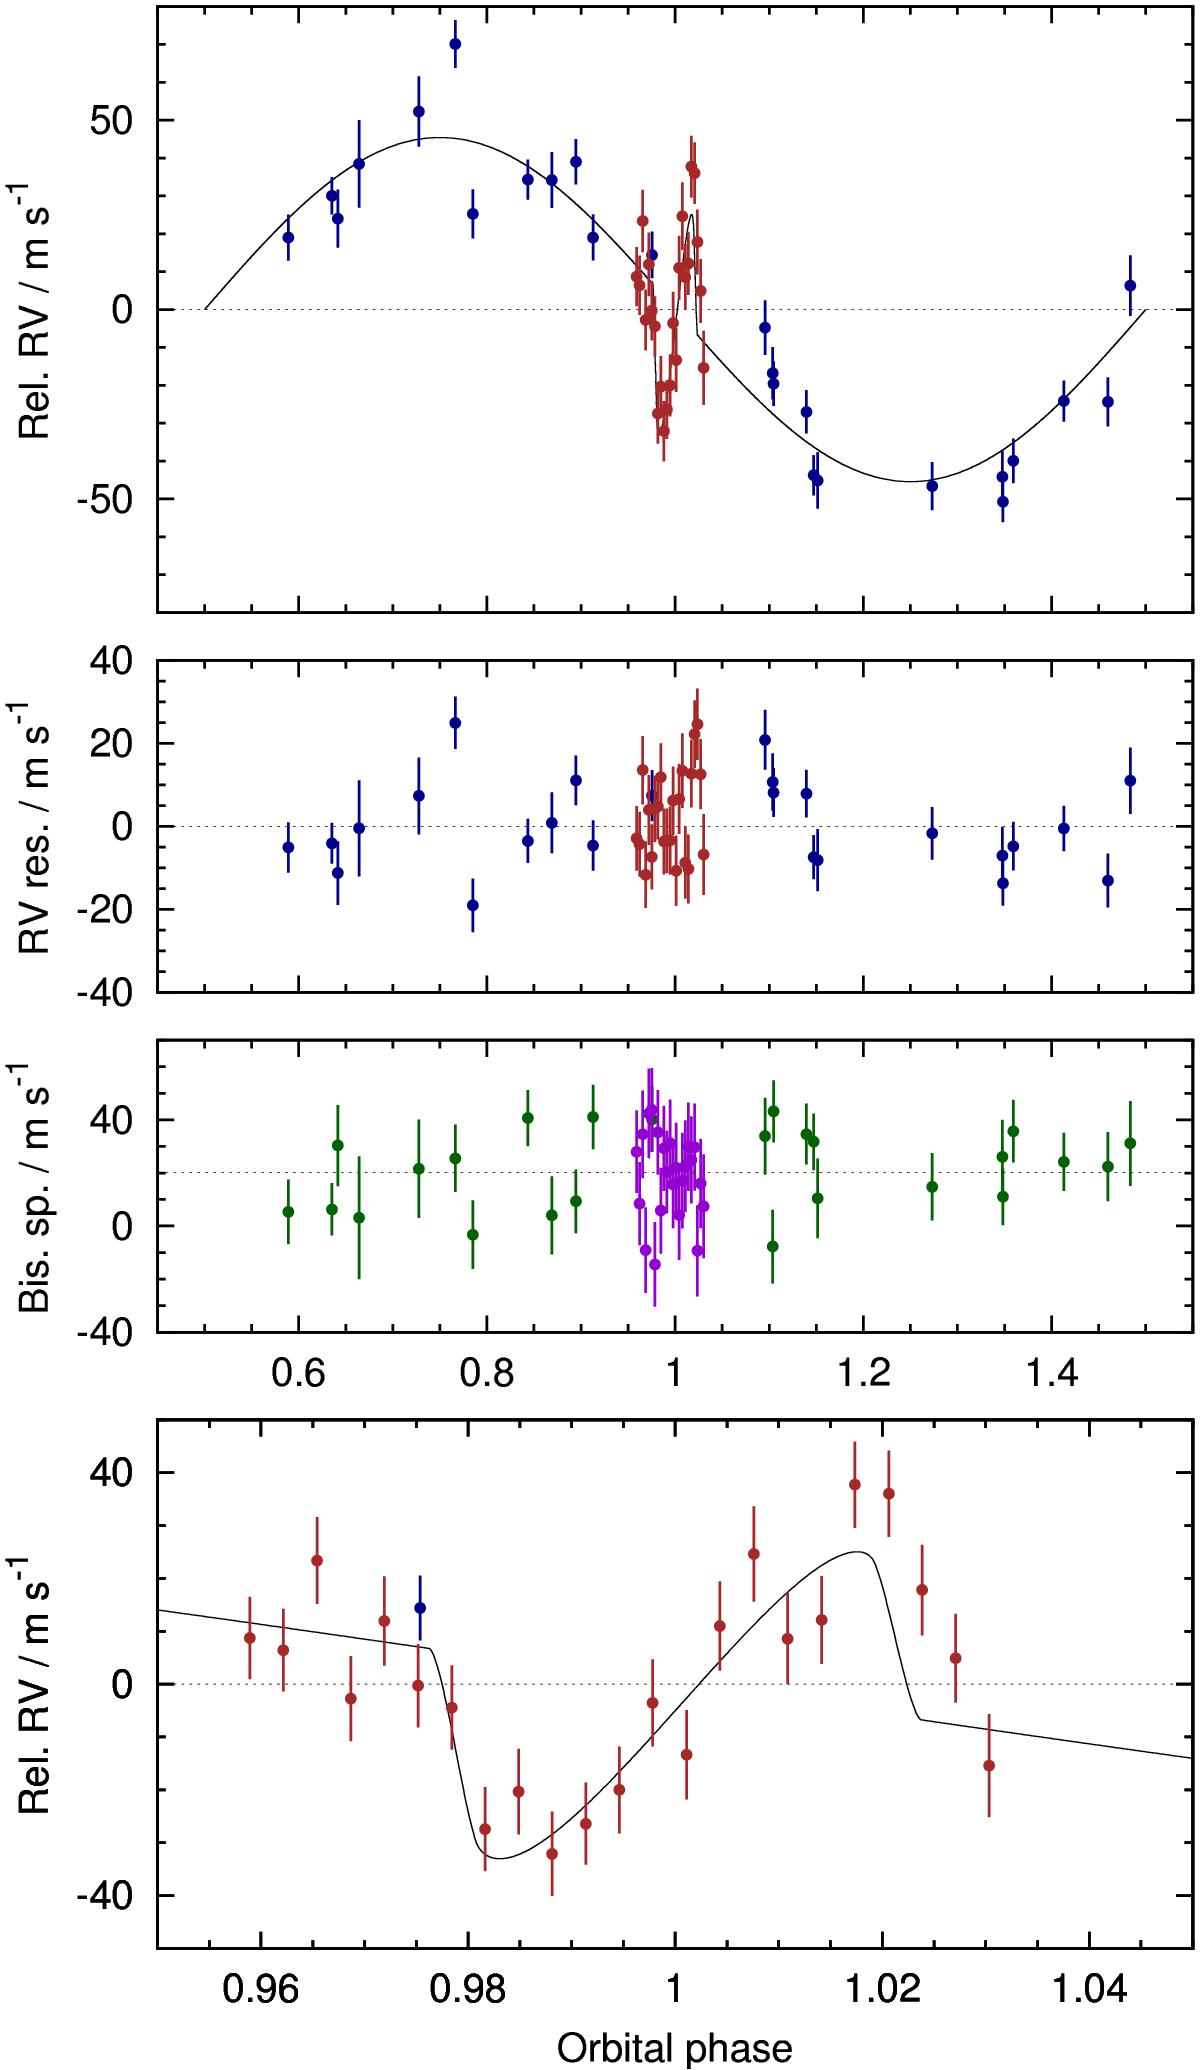
WASP-94Ab spectroscopic data and fitted MCMC model. Top: the CORALIE radial velocities phased at the transit period over-plotted with the best-fit solution. Second panel: the residuals of the fit. Third panel: the bisector spans. Bottom: zoom on the CORALIE radial velocities taken during the transit over-plotted with the best solution for the Rossiter-McLaughlin effect.
Current usage metrics show cumulative count of Article Views (full-text article views including HTML views, PDF and ePub downloads, according to the available data) and Abstracts Views on Vision4Press platform.
Data correspond to usage on the plateform after 2015. The current usage metrics is available 48-96 hours after online publication and is updated daily on week days.
Initial download of the metrics may take a while.