Fig. 4
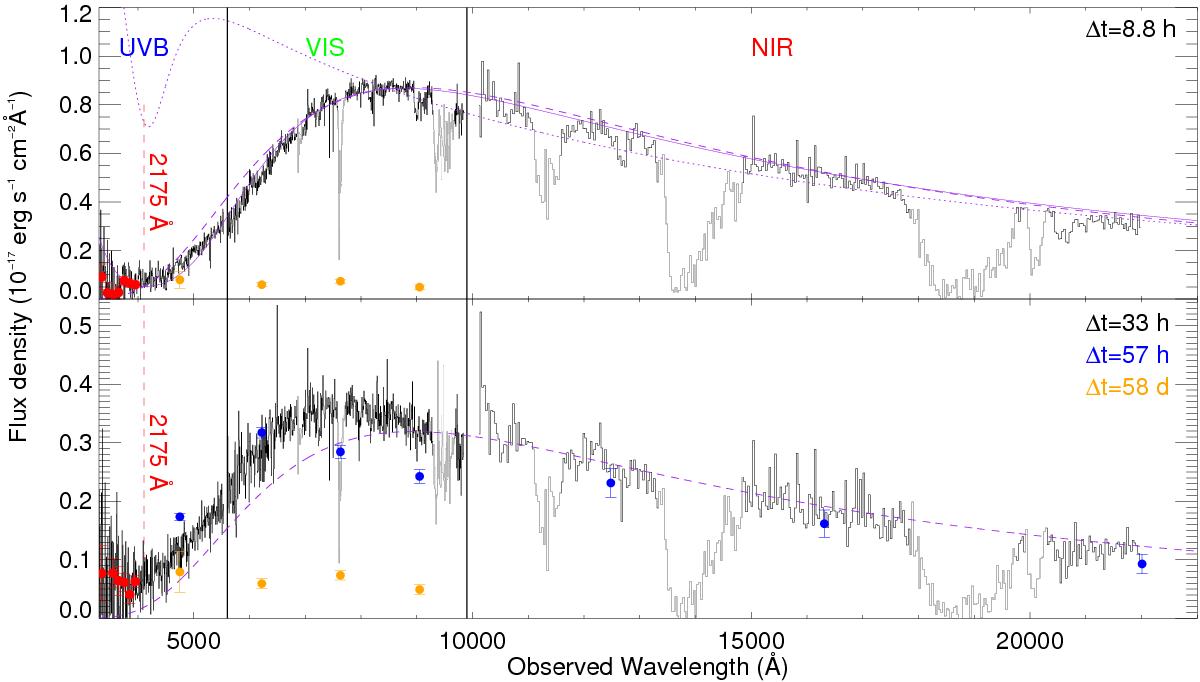
X-shooter spectra taken 8.8 h (top) and 33 h (bottom) after the burst. The spectra are binned for better visibility. The red points show the spectrum at λ< 4000 Å binned in 100 Å bins. Regions affected by telluric absorption are plotted in light grey. Also overplotted on the first epoch spectrum is a power-law (with slope set by a fit to the X-ray afterglow and assuming a Δβ = 0.5 cooling break between the X-rays and the optical) reddened by three different prescriptions: MW extinction curve (dotted line), extreme 2175 Å extinction bump (solid line), and extinction with multiple scattering (dashed line). The shape of the second epoch spectrum is generally similar to the spectrum from the first epoch, but the flux drop occurs at slightly bluer wavelengths. To make this clearer we rescale and overplot the modelling of multiple scattering from the first epoch on the spectrum of the second epoch. Furthermore, we show with blue points the GROND photometry from about 57 h after the burst, corrected for host galaxy emission, and with orange points the host photometry from 58 days after the burst.
Current usage metrics show cumulative count of Article Views (full-text article views including HTML views, PDF and ePub downloads, according to the available data) and Abstracts Views on Vision4Press platform.
Data correspond to usage on the plateform after 2015. The current usage metrics is available 48-96 hours after online publication and is updated daily on week days.
Initial download of the metrics may take a while.