Free Access
Fig. 3
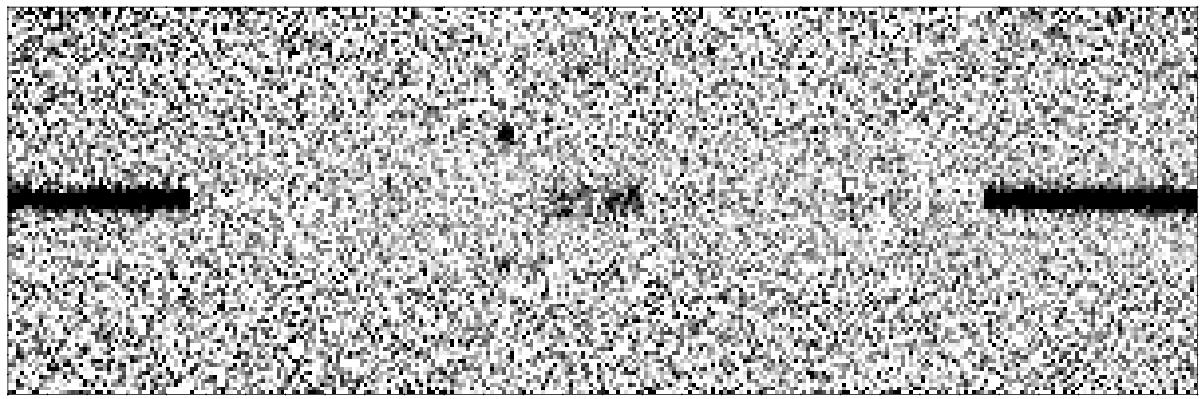
[Oii] emission line doublet from the underlying host galaxy. The afterglow has been subtracted assuming that the afterglow spectrum can be approximated by a linear function across the position of the line (the compact dot above the trace is a cosmic ray hit). Based on the line we infer a star formation rate of 1 M⊙ yr-1.
Current usage metrics show cumulative count of Article Views (full-text article views including HTML views, PDF and ePub downloads, according to the available data) and Abstracts Views on Vision4Press platform.
Data correspond to usage on the plateform after 2015. The current usage metrics is available 48-96 hours after online publication and is updated daily on week days.
Initial download of the metrics may take a while.