Fig. 2
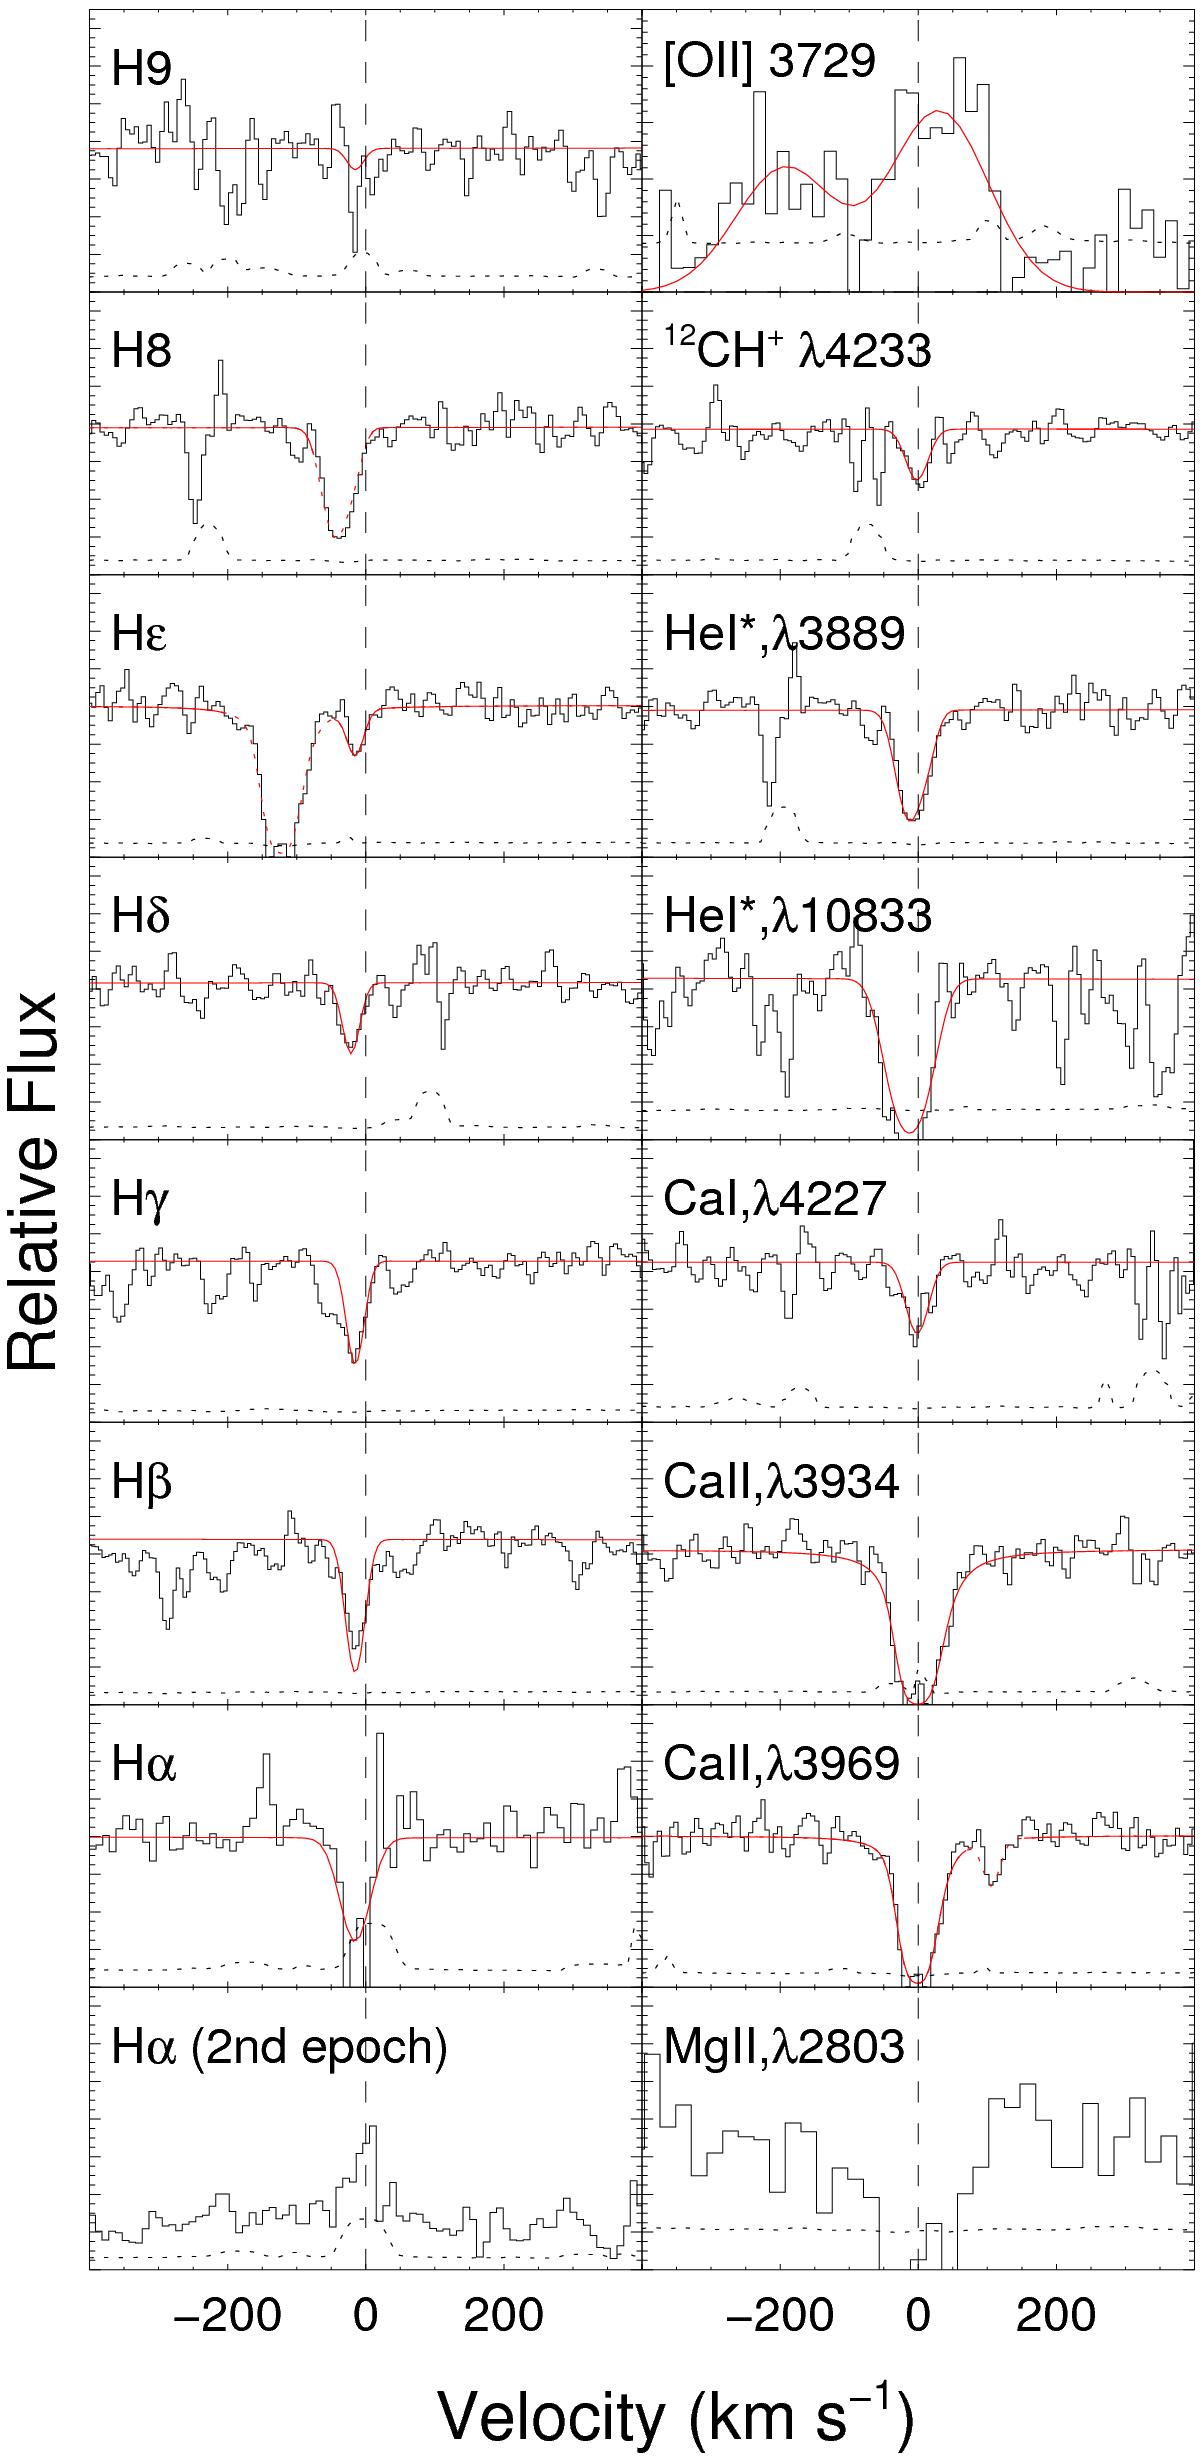
Main absorption and emission lines in the spectrum. The noise spectra are overplotted with a dotted line and the plot range on the y-axis starts at zero. The scale on the y-axis is arbitrary. The zero point for the velocity scale is set to z = 0.88911. In the left column we show the Balmer lines that are centred at −14 km s-1 (z = 0.88902). For Hα we show the region around the line from both X-shooter spectra. In the right column we show Ca ii and Ca i, the He i* lines centred at −11 km s-1 (z = 0.88904) and the CH+ line centred at the same velocity as the Ca ii lines. We also show the [Oii] doublet, which is redshifted by 30 km s-1 relative to Ca ii and have a velocity width of 150 km s-1. We note that H8 is blended with He i*λ3889. Also overplotted are Voigt profile fits to the absorption lines (except Mg ii that is in the UVB part of the spectrum where the signal-to-noise ratio is too low) and a Gaussian fit to the [Oii] doublet. For the Ca ii lines we only show the Voigt-fits with a single absorption component.
Current usage metrics show cumulative count of Article Views (full-text article views including HTML views, PDF and ePub downloads, according to the available data) and Abstracts Views on Vision4Press platform.
Data correspond to usage on the plateform after 2015. The current usage metrics is available 48-96 hours after online publication and is updated daily on week days.
Initial download of the metrics may take a while.