Free Access
Fig. 6
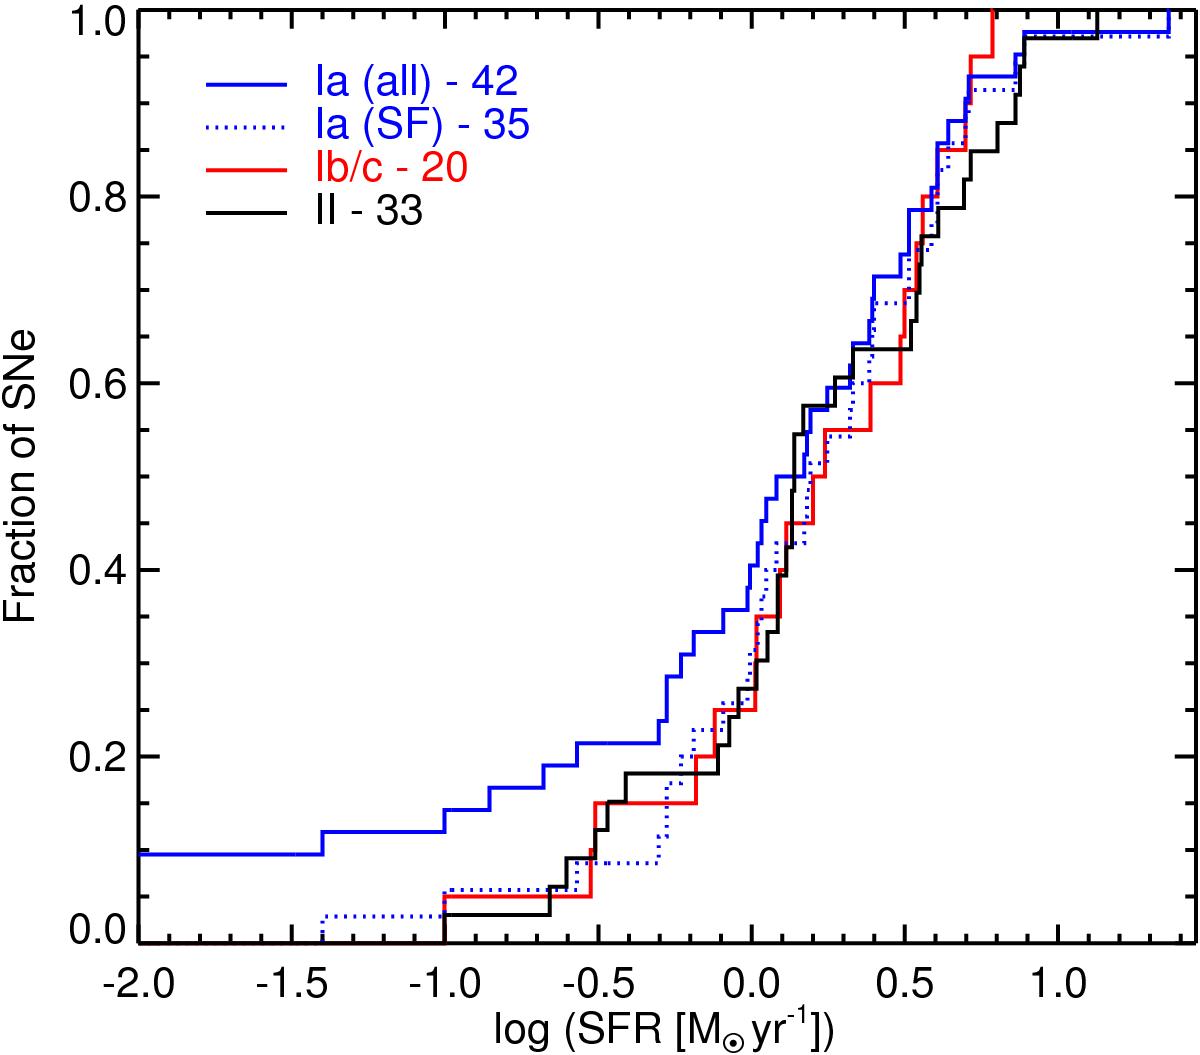
Cumulative distribution of the ongoing total SFR in the host of the three main SN types. In this and the following CD plots the ordinate indicates the fraction of SN with values lower than the abscissa value. In some plots the vertical lines show the mean value of each distribution.
Current usage metrics show cumulative count of Article Views (full-text article views including HTML views, PDF and ePub downloads, according to the available data) and Abstracts Views on Vision4Press platform.
Data correspond to usage on the plateform after 2015. The current usage metrics is available 48-96 hours after online publication and is updated daily on week days.
Initial download of the metrics may take a while.