Fig. 5
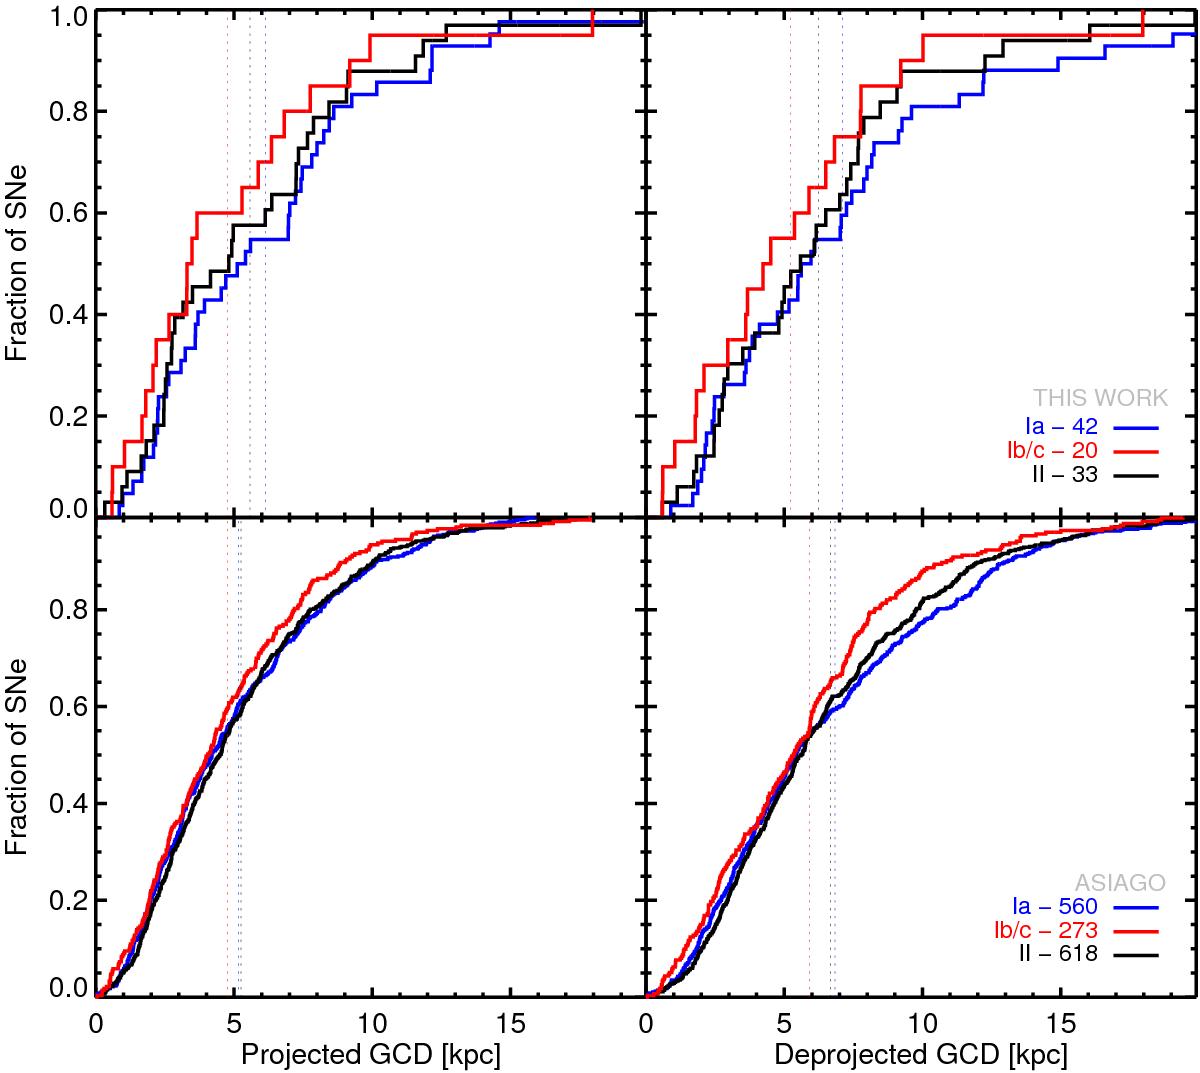
Cumulative distributions of GCD measurements. Top: projected GCD in kpc (left), and deprojected GCD in kpc (right). Bottom: as a comparison, the same plots with SNe from the Asiago SN catalog. The ordinate indicates the fraction of the SN population with GCD lower than the abscissa value, and vertical lines show the mean value of each distribution.
Current usage metrics show cumulative count of Article Views (full-text article views including HTML views, PDF and ePub downloads, according to the available data) and Abstracts Views on Vision4Press platform.
Data correspond to usage on the plateform after 2015. The current usage metrics is available 48-96 hours after online publication and is updated daily on week days.
Initial download of the metrics may take a while.