Fig. 4
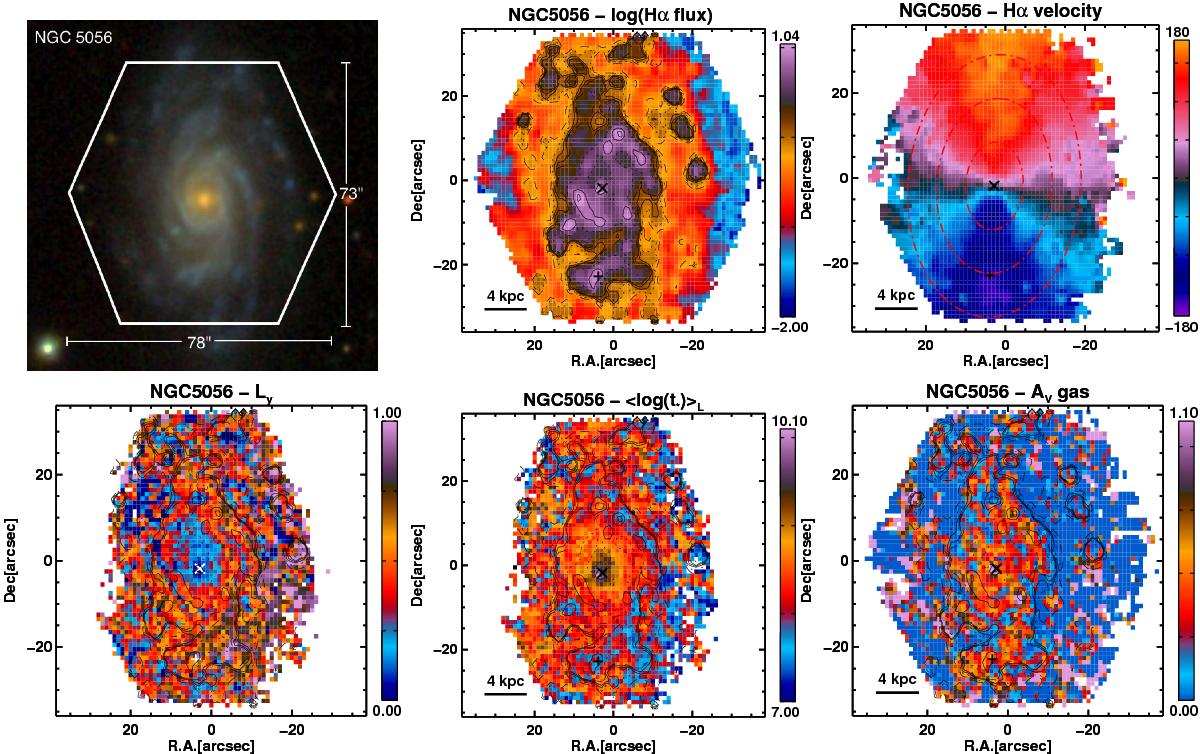
Top: from left to right, SDSS image of NGC 5056 with the PPAK aperture superimposed on scale; two-dimensional maps of the extinction-corrected Hα flux and the velocity measured from the Hα-line shift. Bottom: from left to right, two-dimensional maps of the contribution of the young stars (<100 Myr) to the total luminosity, the light-weighted average stellar age, and the extinction (AV). In all 2D maps with IFS data, × determines the galaxy center and + the SN position. The contour levels overplotted on the maps are derived from the Hα flux map. The x − y coordinates are in arcsec with respect to the center of the FoV. The orientation of the images is north up, east left.
Current usage metrics show cumulative count of Article Views (full-text article views including HTML views, PDF and ePub downloads, according to the available data) and Abstracts Views on Vision4Press platform.
Data correspond to usage on the plateform after 2015. The current usage metrics is available 48-96 hours after online publication and is updated daily on week days.
Initial download of the metrics may take a while.