Fig. 3
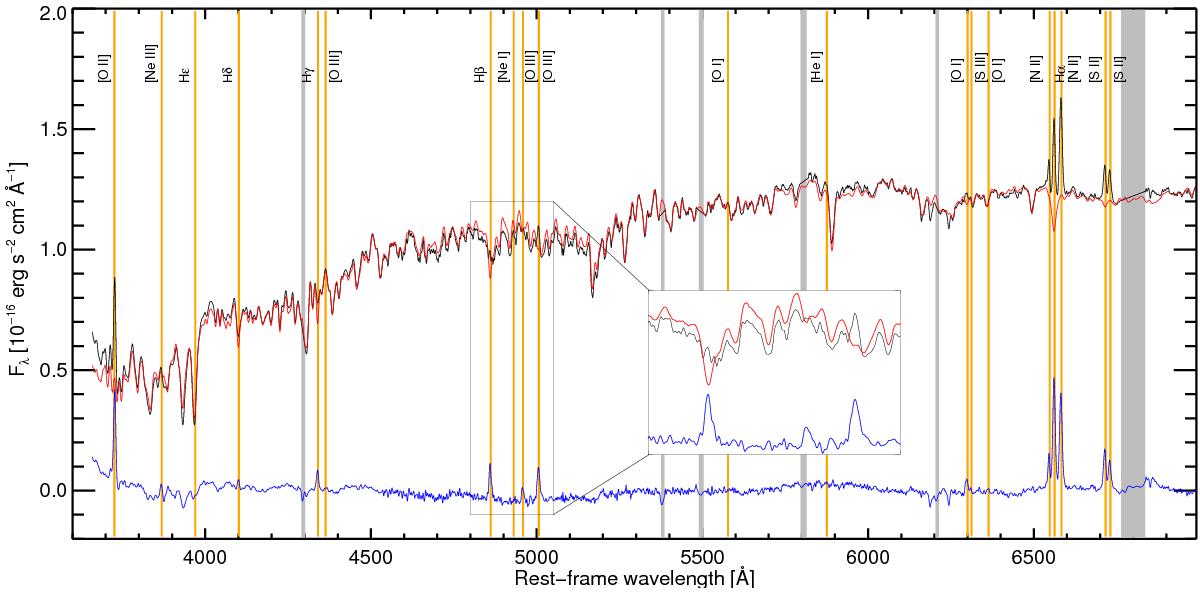
Spectrum of NGC 2347 nucleus (black), together with the best STARLIGHT fit (red) and the pure nebular emission line spectrum (the difference, in blue). Note that the original spectrum is less noisy below 4500 Å, where the original V1200 spectrum has been degraded to the V500 resolution (6 Å). Gray shadows are the wavelength ranges masked in the stellar population fit. Orange lines correspond the positions of the fitted emission lines. The region around Hβ and [O iii] λ4959 is zoomed in the inset to show that the emission lines are clearly seen only in the difference spectrum. Note also that the [N ii] λ6583 line in the observed spectrum is higher than Hα, but it is lower in the continuum-subtracted spectrum.
Current usage metrics show cumulative count of Article Views (full-text article views including HTML views, PDF and ePub downloads, according to the available data) and Abstracts Views on Vision4Press platform.
Data correspond to usage on the plateform after 2015. The current usage metrics is available 48-96 hours after online publication and is updated daily on week days.
Initial download of the metrics may take a while.