Fig. 2
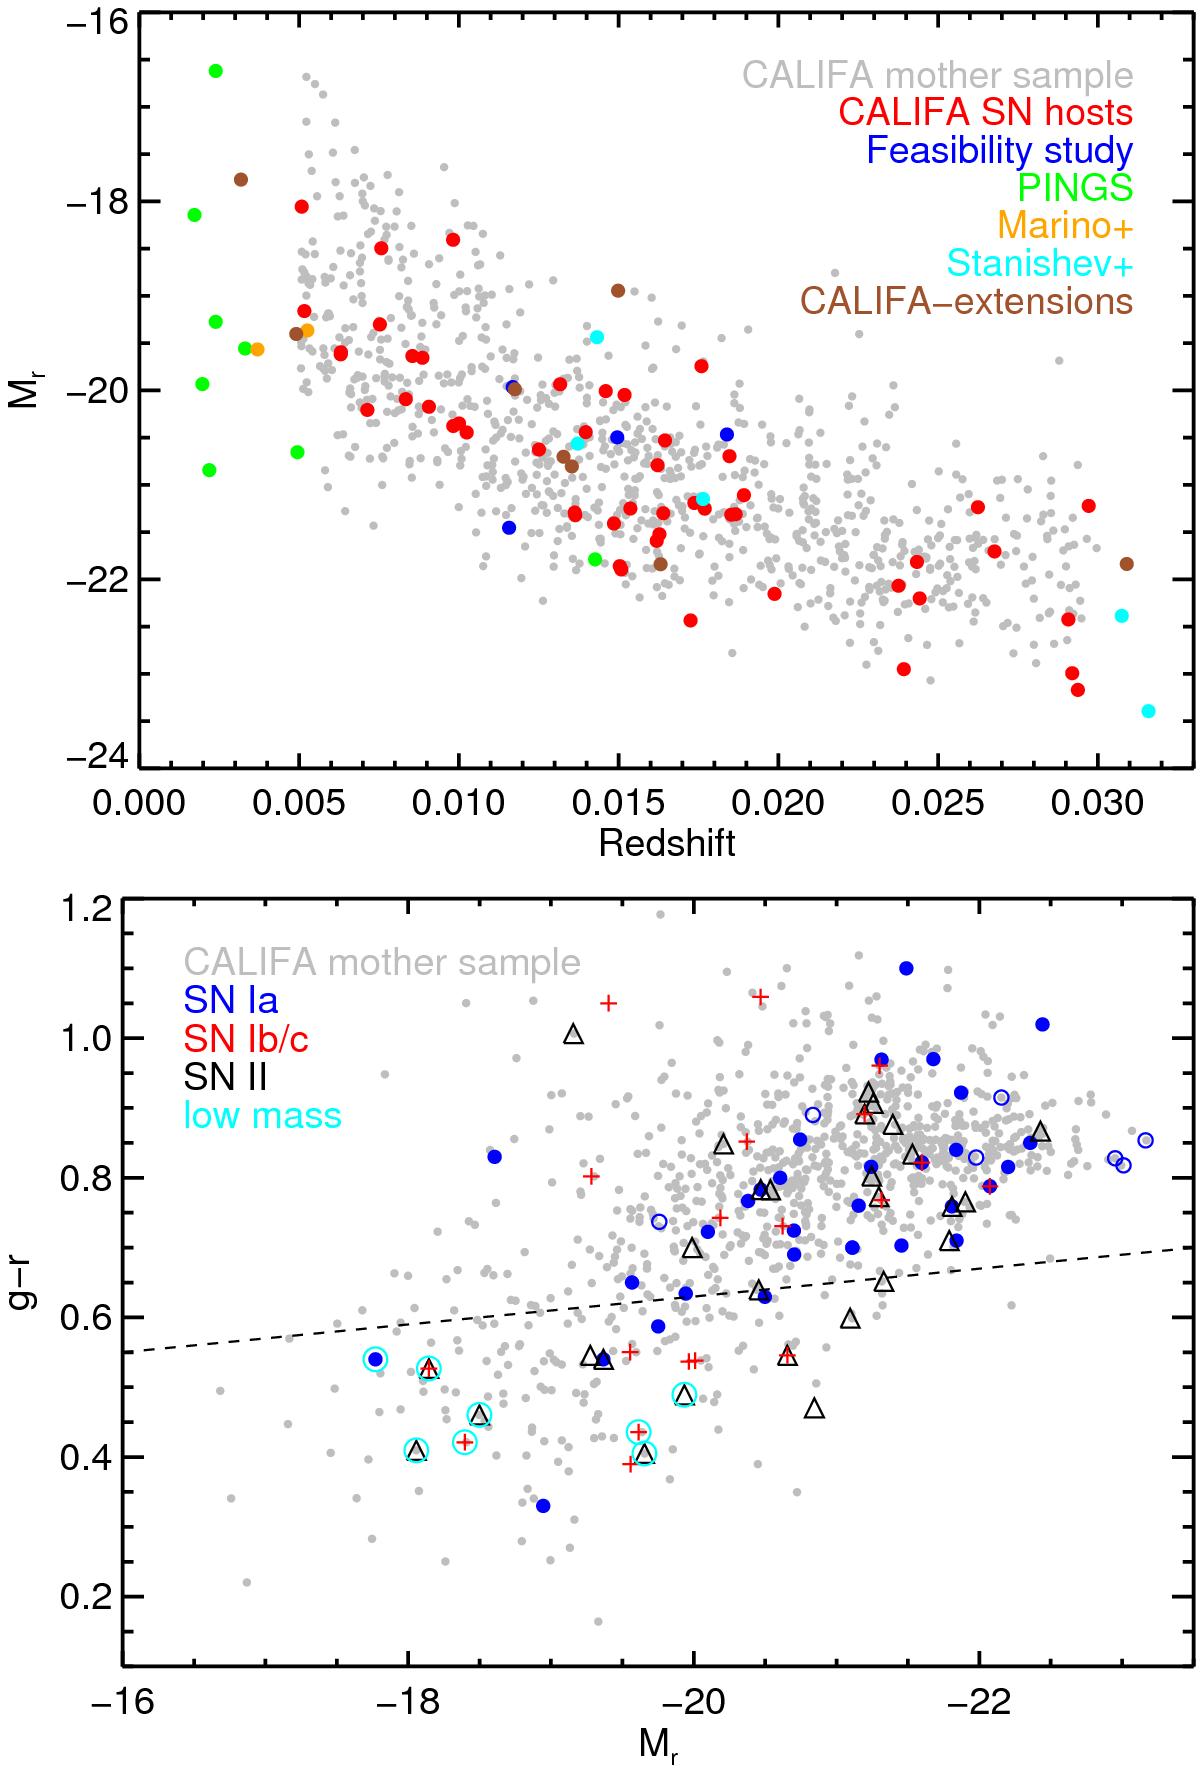
Upper panel: absolute r-band magnitude Mr vs. redshift of the whole CALIFA mother sample (gray dots) compared with the SN host galaxy sample used in this work from different sources (larger dots in different colors). Note that PINGS galaxies are more nearby than CALIFA galaxies. Lower panel: g − r color vs. Mr diagram of the CALIFA mother sample and the galaxies studied in this work. The dotted line shows the separation between blue from red galaxies proposed by Masters et al. (2010). The open blue circles show the passive SN Ia hosts (see Sect. 4). The points encircled with cyan open circles are the eight least massive galaxies in our sample (see Sect. 5.2), which are all blue.
Current usage metrics show cumulative count of Article Views (full-text article views including HTML views, PDF and ePub downloads, according to the available data) and Abstracts Views on Vision4Press platform.
Data correspond to usage on the plateform after 2015. The current usage metrics is available 48-96 hours after online publication and is updated daily on week days.
Initial download of the metrics may take a while.