Free Access
Fig. 14
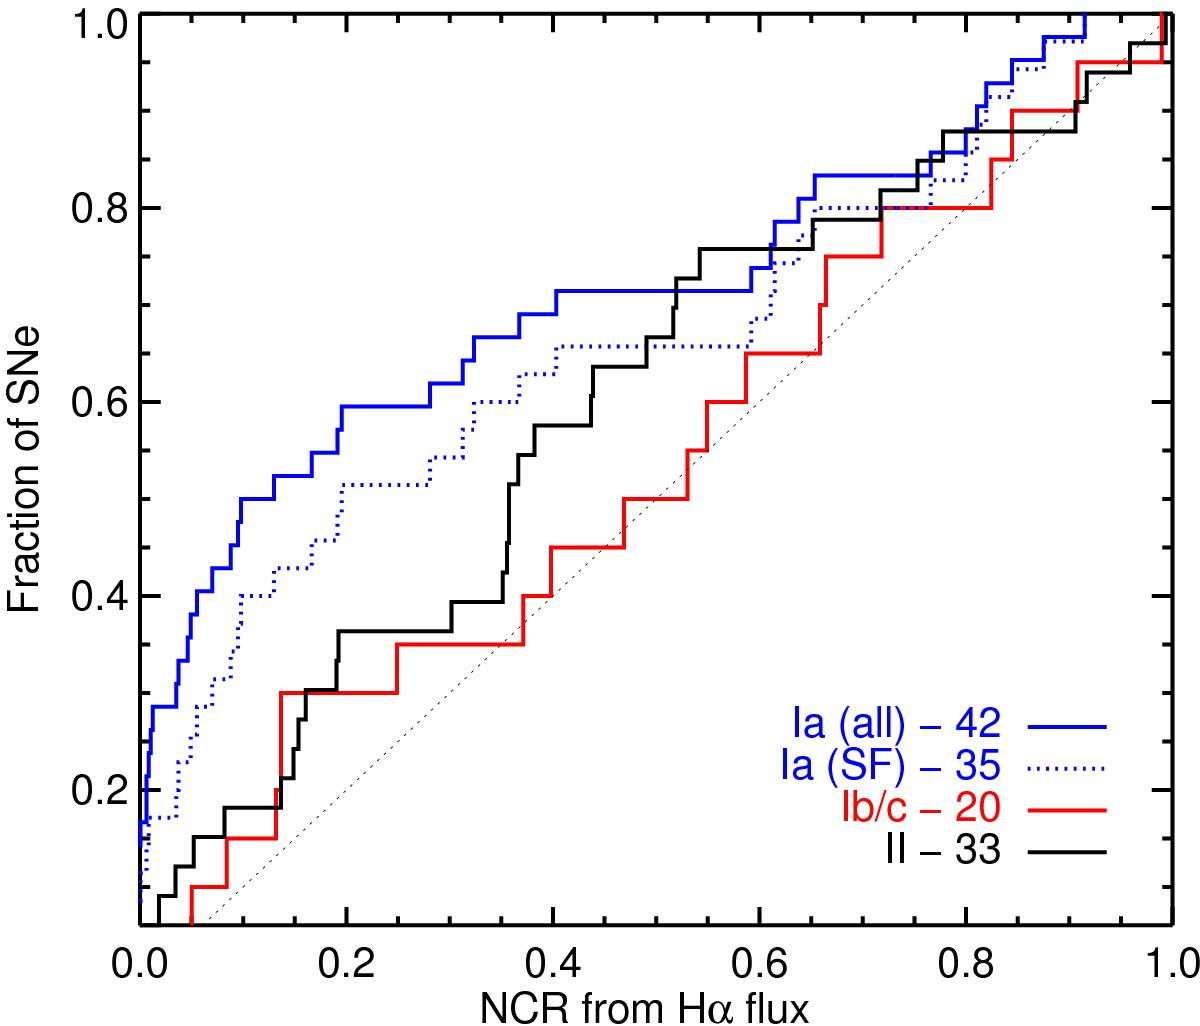
NCR from Hα flux maps for the 3 SN types. The diagonal line represent a cumulative distribution perfectly describing the star formation in the galaxy. We excluded the 7 SNe Ia in galaxies without emission lines to properly compare the distributions of each SN type in similar galaxies.
Current usage metrics show cumulative count of Article Views (full-text article views including HTML views, PDF and ePub downloads, according to the available data) and Abstracts Views on Vision4Press platform.
Data correspond to usage on the plateform after 2015. The current usage metrics is available 48-96 hours after online publication and is updated daily on week days.
Initial download of the metrics may take a while.