Free Access
Fig. 13
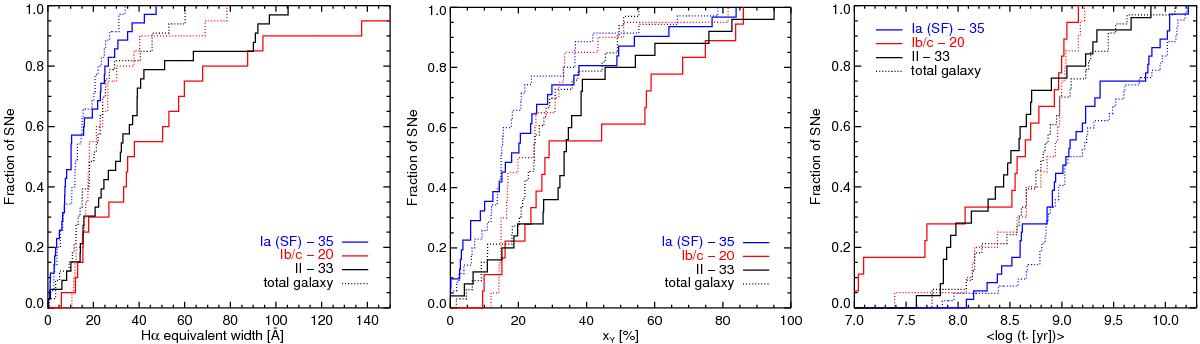
Cumulative distributions of the Hα equivalent width (left), the contribution of young SPs (middle), and the mean light-weighted logarithm of the stellar population age (right). The solid lines show the CDs of the quantities at the SN position and the dotted lines from the total spectra.
This figure is made of several images, please see below:
Current usage metrics show cumulative count of Article Views (full-text article views including HTML views, PDF and ePub downloads, according to the available data) and Abstracts Views on Vision4Press platform.
Data correspond to usage on the plateform after 2015. The current usage metrics is available 48-96 hours after online publication and is updated daily on week days.
Initial download of the metrics may take a while.