Fig. 3
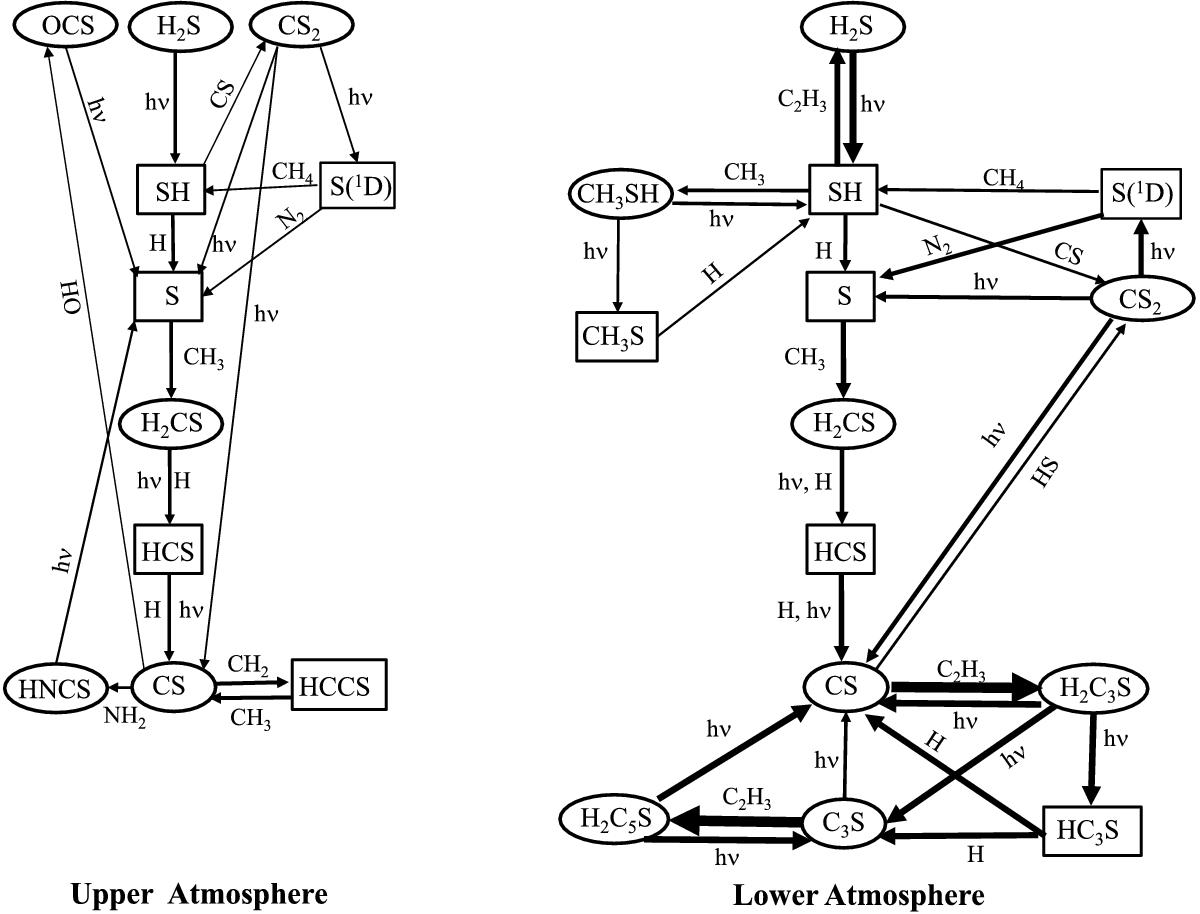
Schematic diagrams highlighting the important neutral reaction pathways for the production of sulfur species in the higher part of the atmosphere (left) and in the lower stratosphere (right). The thickness of each arrow is proportional to the integral of the total production rate over the atmosphere. These main reactions pathways are identical for the three models considered in the present study. Radicals are shown in boxes, whereas stable compounds are shown in circles.
Current usage metrics show cumulative count of Article Views (full-text article views including HTML views, PDF and ePub downloads, according to the available data) and Abstracts Views on Vision4Press platform.
Data correspond to usage on the plateform after 2015. The current usage metrics is available 48-96 hours after online publication and is updated daily on week days.
Initial download of the metrics may take a while.