Free Access
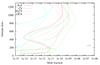
Fig. 2
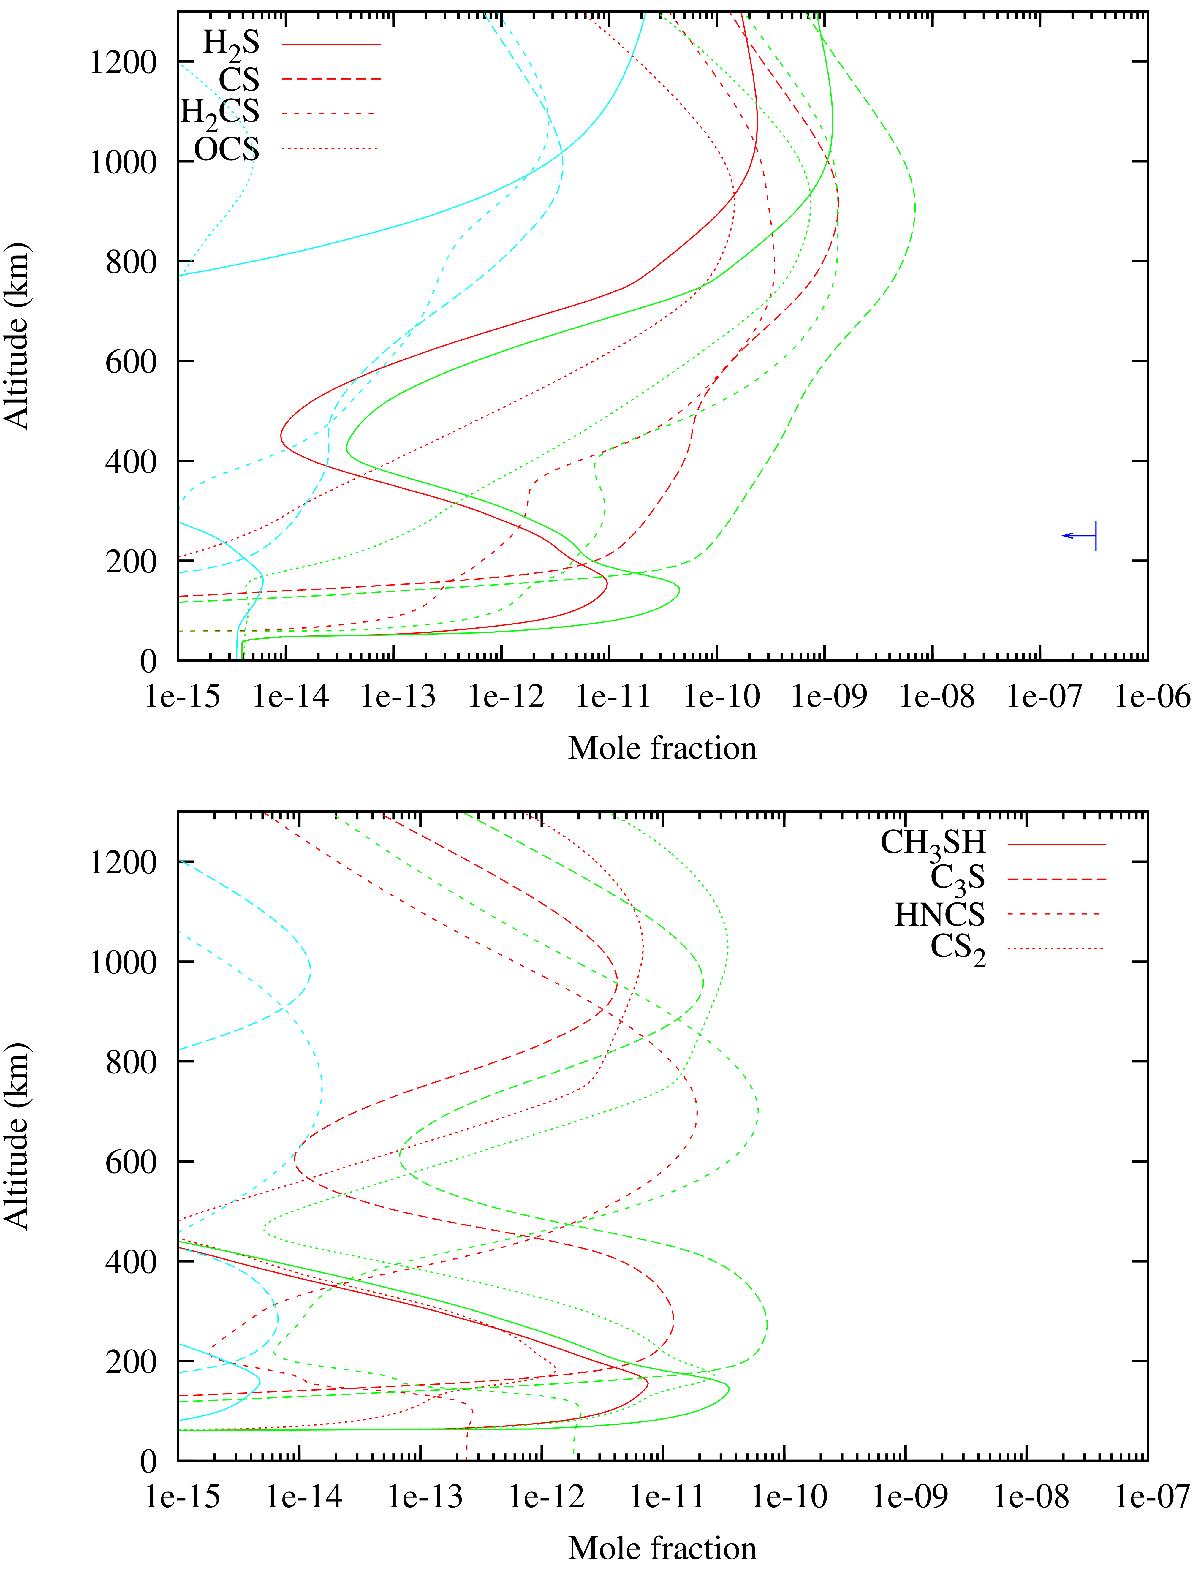
Mole fraction profiles of main sulfur species. Red: Model A1. Green: Model A2. Cyan: Model B. Top: H2S, CS, OCS and H2CS. The upper limit of H2S from Nixon et al. (2013) is shown in blue. Bottom: CH3SH, C3S, HNCS and CS2.
This figure is made of several images, please see below:

Current usage metrics show cumulative count of Article Views (full-text article views including HTML views, PDF and ePub downloads, according to the available data) and Abstracts Views on Vision4Press platform.
Data correspond to usage on the plateform after 2015. The current usage metrics is available 48-96 hours after online publication and is updated daily on week days.
Initial download of the metrics may take a while.