Fig. 1
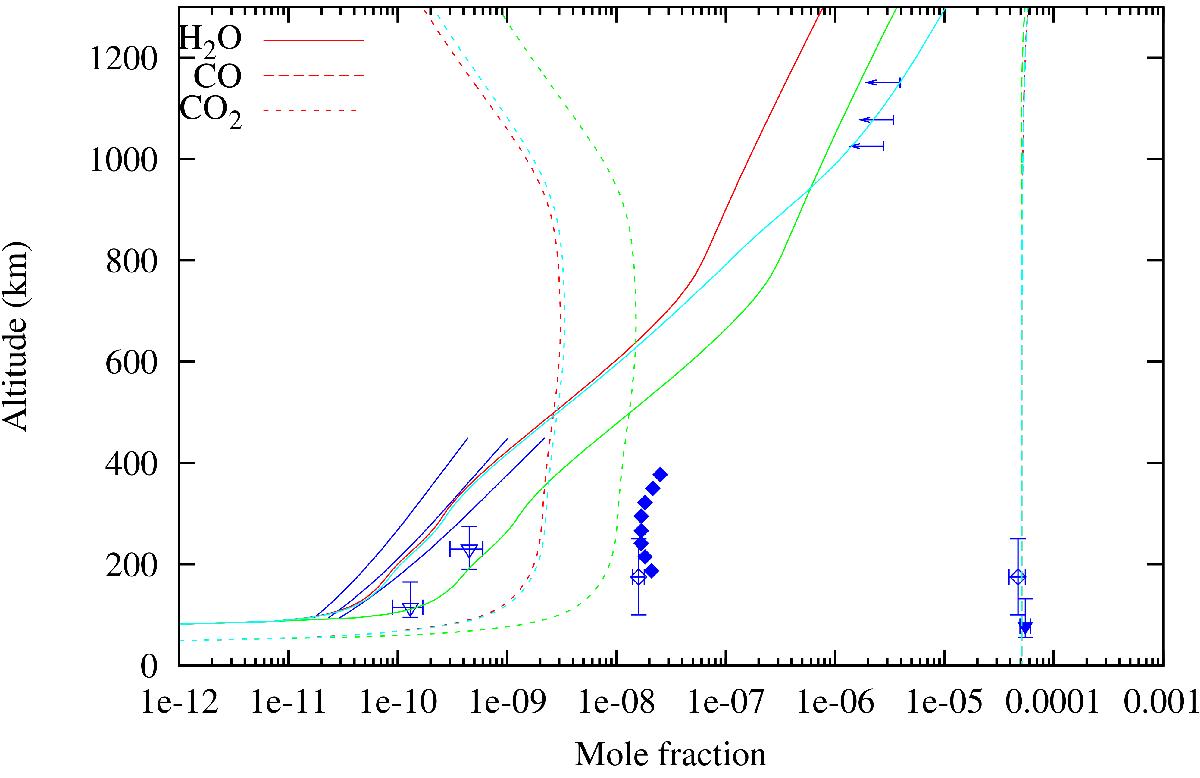
H2O (solid line), CO (long dashed line), and CO2 (short dashed line) mole fractions as a function of altitude for the three models listed in Table 1. Observations (in blue) from Moreno et al. (2012) (solid lines for mean and 1-σ uncertainty), Cottini et al. (2012) (open triangles), and upper limits from INMS data (Cui et al. 2009) for H2O, from de Kok et al. (2007) for CO and CO2 (open diamonds), from Vinatier et al. (2010) for CO2 (filled diamonds), and from Teanby et al. (2010) for CO (filled triangle) are shown for comparison. Red: Model A1. Green: Model A2. Cyan: Model B. Blue: observations.
Current usage metrics show cumulative count of Article Views (full-text article views including HTML views, PDF and ePub downloads, according to the available data) and Abstracts Views on Vision4Press platform.
Data correspond to usage on the plateform after 2015. The current usage metrics is available 48-96 hours after online publication and is updated daily on week days.
Initial download of the metrics may take a while.