Fig. A.1
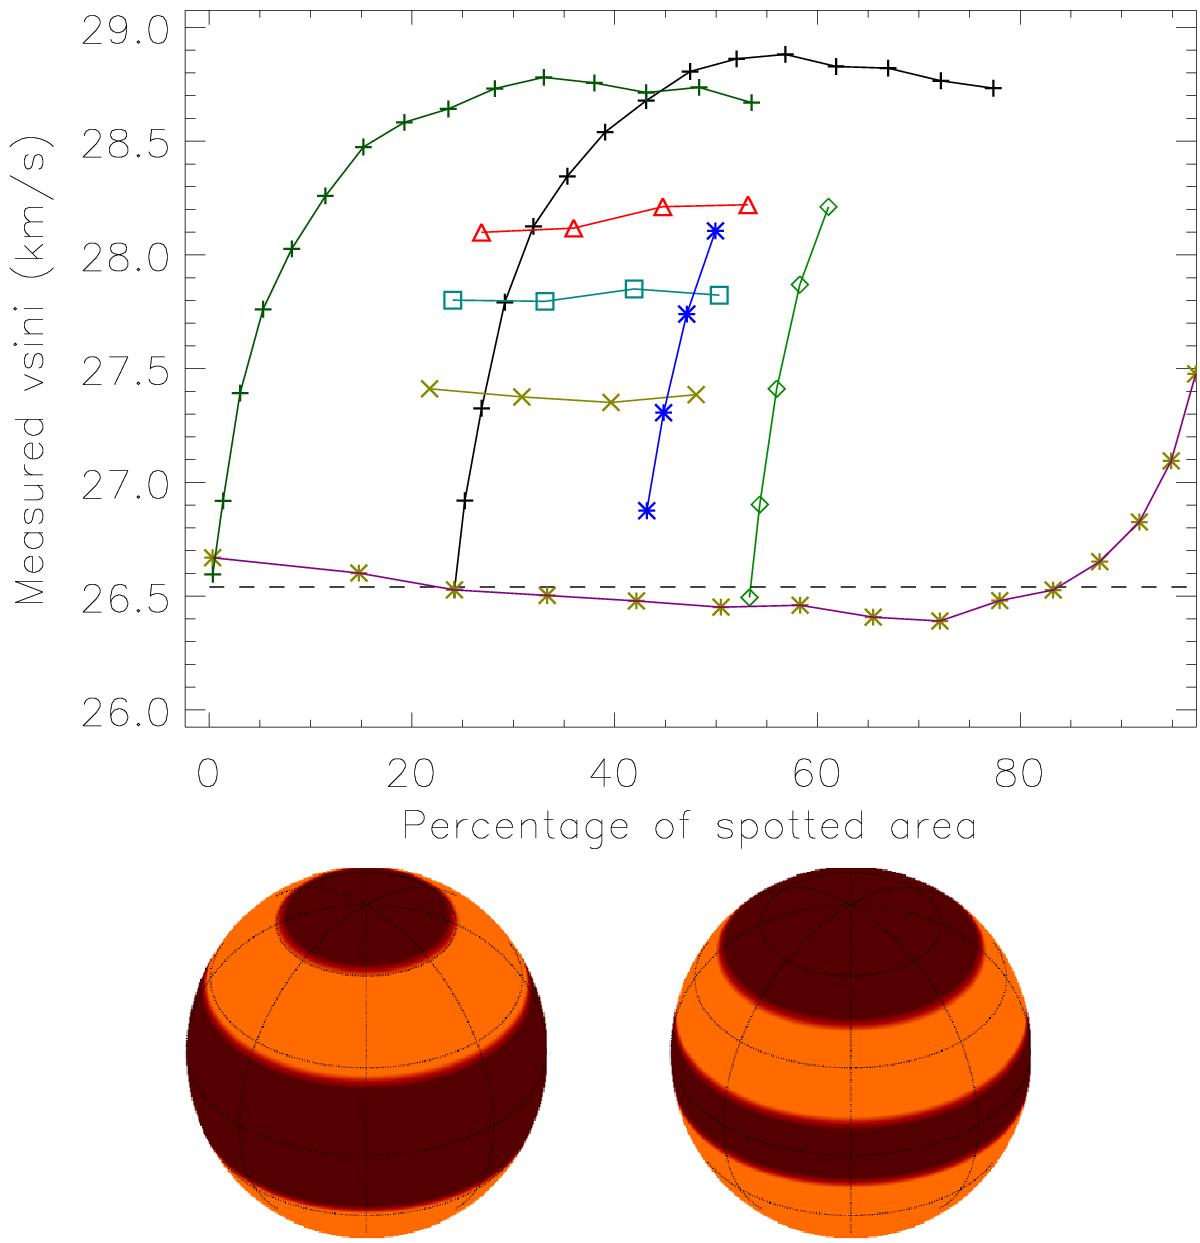
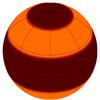
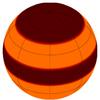
Dependency test of measured v sin i on spot coverage. Shrinking polar caps from 30° radius by 5° steps with a constant equatorial belt between −30° and + 30° and −25° and + 25° latitudes are represented by diamonds and stars, respectively; the effect of a huge shrinking polar cap from 45° radius by 5° steps with a thin equatorial belt between −10° and + 10°, and without equatorial belt, are represented by plusses (vertical structures from the right to the left). The starting v sin i of 26.5 is represented by a dashed line, around it is seen the effect of an equatorial belt without a polar cap marked with stars; crosses, squares and triangles denote shrinking equatorial belts from −30° and + 30° with 5° steps and with constant radii of polar caps of 15°,20° and 25°, respectively (horizontal structures upwards). Below: two representative starting configurations are given to visualize the spots.
Current usage metrics show cumulative count of Article Views (full-text article views including HTML views, PDF and ePub downloads, according to the available data) and Abstracts Views on Vision4Press platform.
Data correspond to usage on the plateform after 2015. The current usage metrics is available 48-96 hours after online publication and is updated daily on week days.
Initial download of the metrics may take a while.