Free Access
Fig. 7
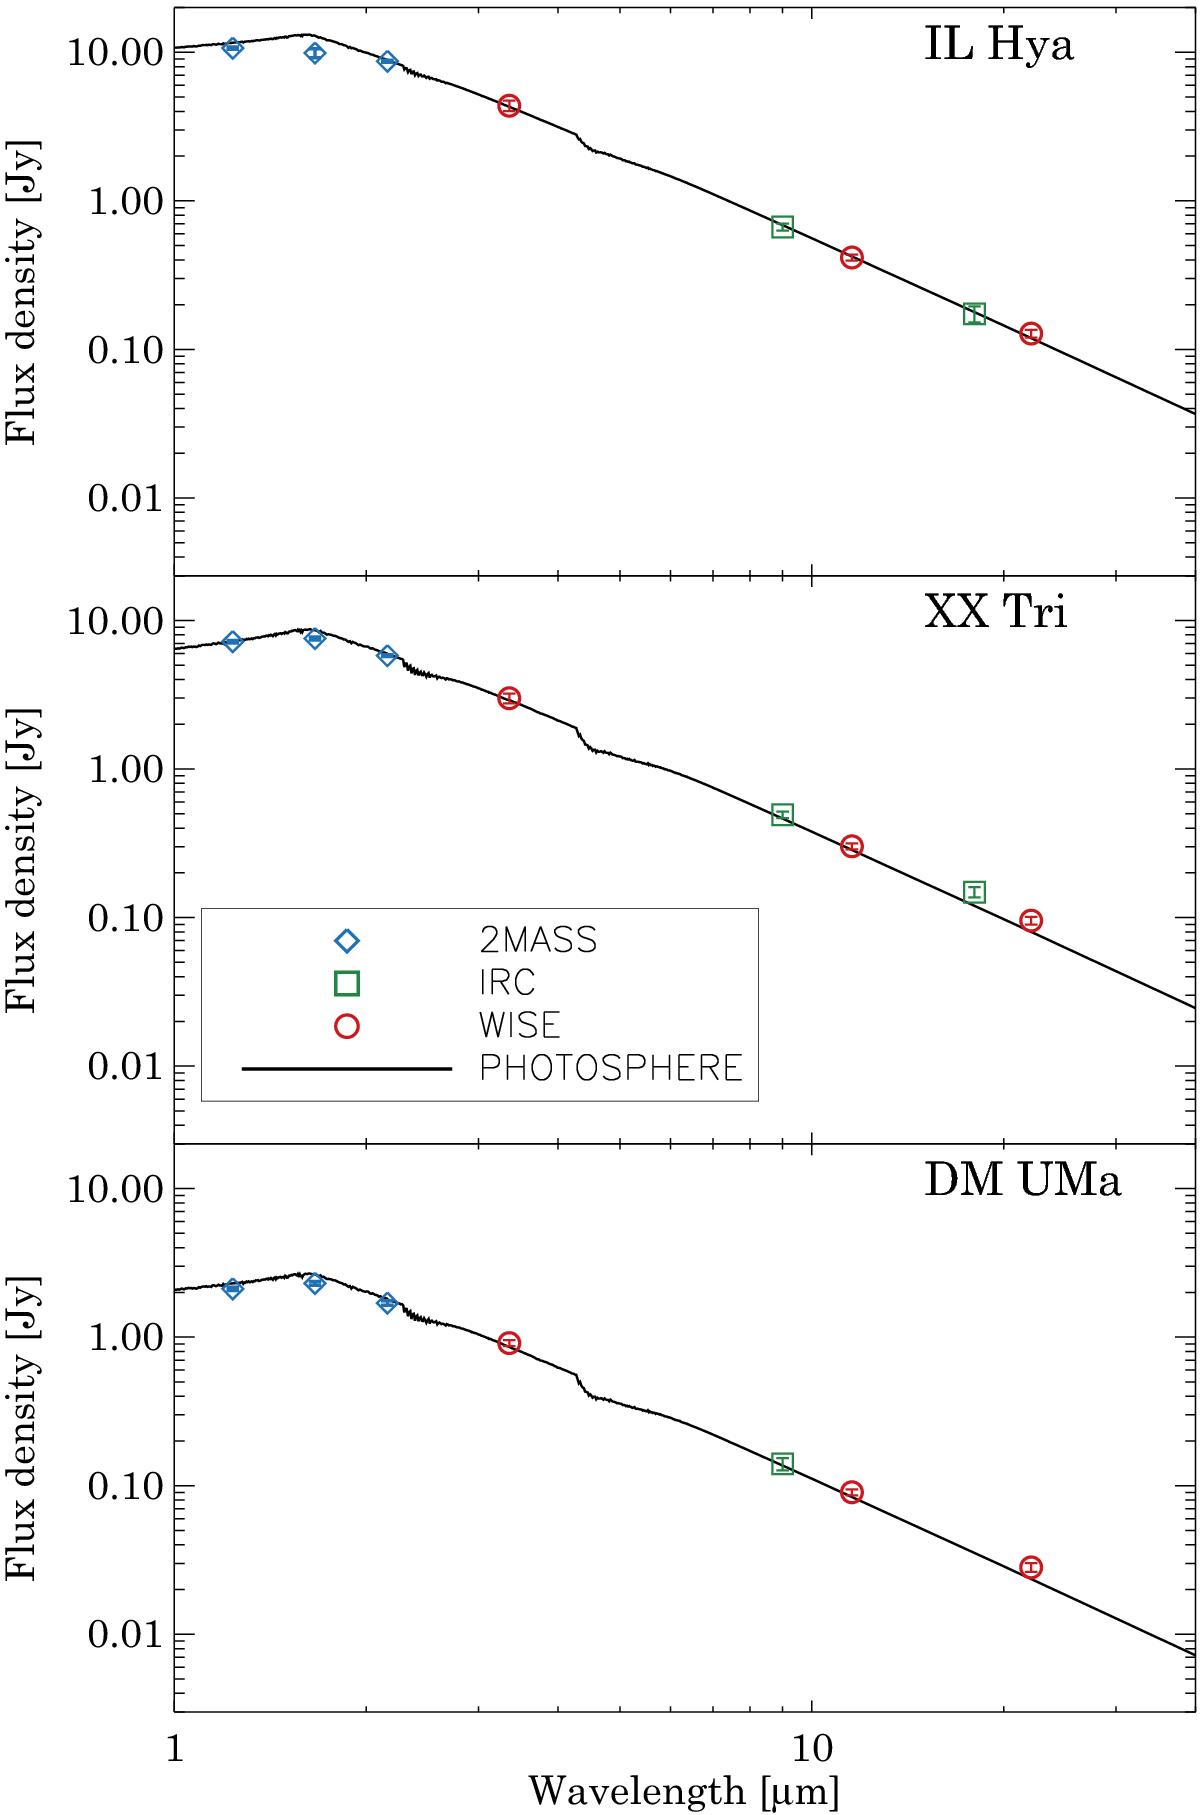
Spectral energy distribution of IL Hya, XX Tri, and DM UMA in the near- and mid-infrared using the ATLAS9 grid of model atmospheres (Castelli & Kurucz 2003); see the text for details.
Current usage metrics show cumulative count of Article Views (full-text article views including HTML views, PDF and ePub downloads, according to the available data) and Abstracts Views on Vision4Press platform.
Data correspond to usage on the plateform after 2015. The current usage metrics is available 48-96 hours after online publication and is updated daily on week days.
Initial download of the metrics may take a while.