Fig. 5
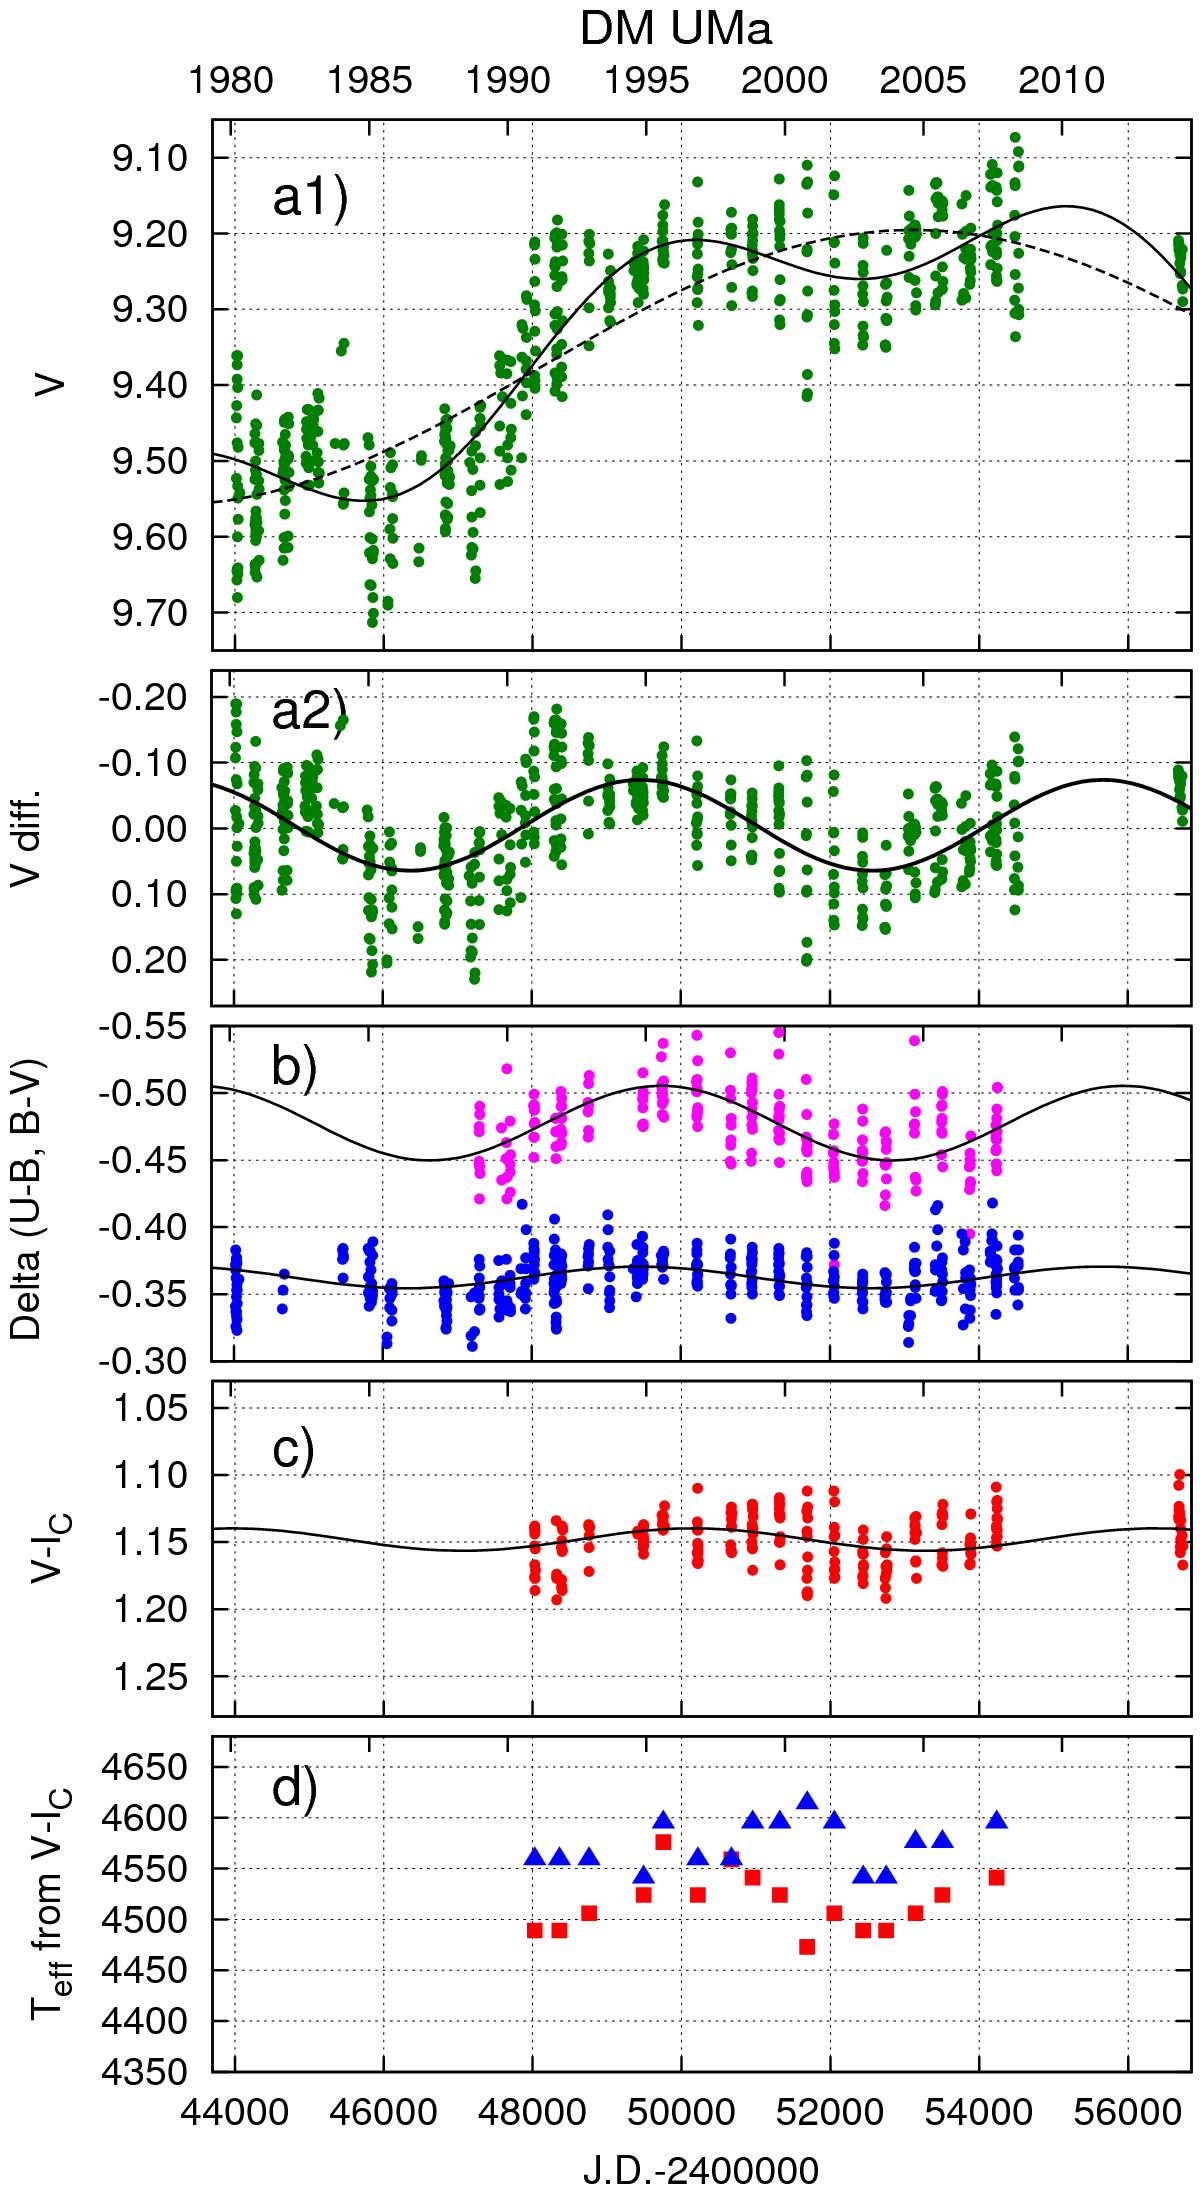
From top to bottom: a1) V light curve with a fit of a long-term trend (dashed line), trend plus a 17 yr variation (full line), a2) V data difference from the long-term trend, showing the 17 yr variation from the fit, b) B − V,U − B color indices overplotted with the 17 yr variation, c) V − IC color index overplotted with the 17 yr variation and d) effective temperatures of DM UMa between 1992−2007. See text for details.
Current usage metrics show cumulative count of Article Views (full-text article views including HTML views, PDF and ePub downloads, according to the available data) and Abstracts Views on Vision4Press platform.
Data correspond to usage on the plateform after 2015. The current usage metrics is available 48-96 hours after online publication and is updated daily on week days.
Initial download of the metrics may take a while.