Fig. 3
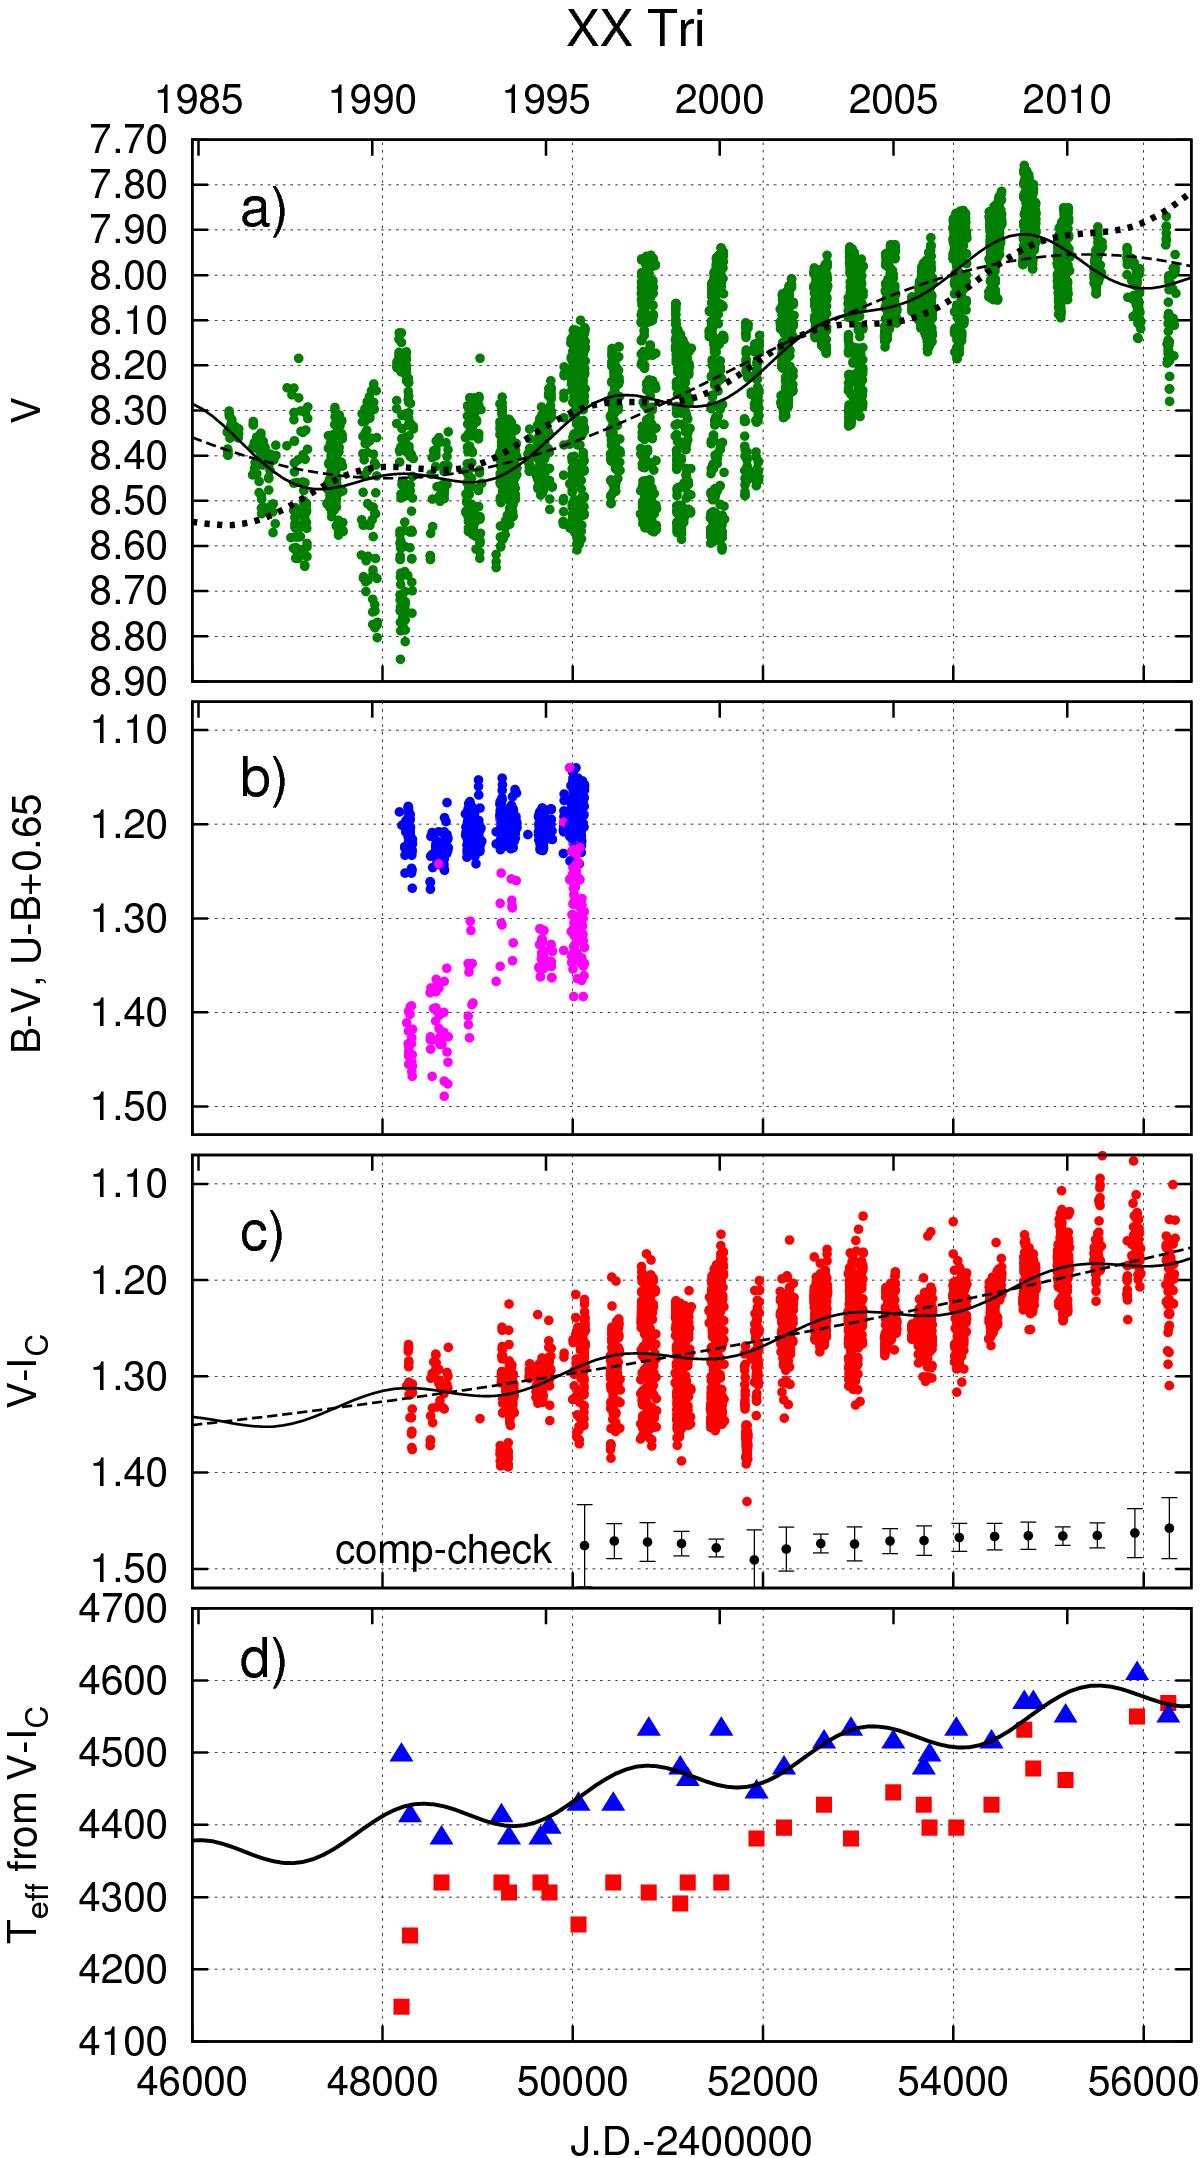
XX Tri light, color, and temperature curves. a) V data (dots) and their fits with a trend (dashed line), with co-added modulations of timescales of 6 yr and 12 yr (line). Dotted line shows the cyclic term from the fit of the V − IC data. b) B − V (upper dots) and U − B (lower dots). The U − B data were artificially shifted by +0![]() 65 for easier presentation. c) V − IC data (dots) and their fits with a trend (dashed line), and with co-added modulation on a timescale of ≈6.5 yr (line). The seasonal average comp-check values are plotted (shifted by +1
65 for easier presentation. c) V − IC data (dots) and their fits with a trend (dashed line), and with co-added modulation on a timescale of ≈6.5 yr (line). The seasonal average comp-check values are plotted (shifted by +1![]() 64 for presentation purpose) measured in the same time, and d) effective temperatures from V − IC at maxima (triangles, overplotted with the 6.5 yr cycle originating from the V − IC fit) and minima (squares) of the light curves. See text for details.
64 for presentation purpose) measured in the same time, and d) effective temperatures from V − IC at maxima (triangles, overplotted with the 6.5 yr cycle originating from the V − IC fit) and minima (squares) of the light curves. See text for details.
Current usage metrics show cumulative count of Article Views (full-text article views including HTML views, PDF and ePub downloads, according to the available data) and Abstracts Views on Vision4Press platform.
Data correspond to usage on the plateform after 2015. The current usage metrics is available 48-96 hours after online publication and is updated daily on week days.
Initial download of the metrics may take a while.