Fig. 2
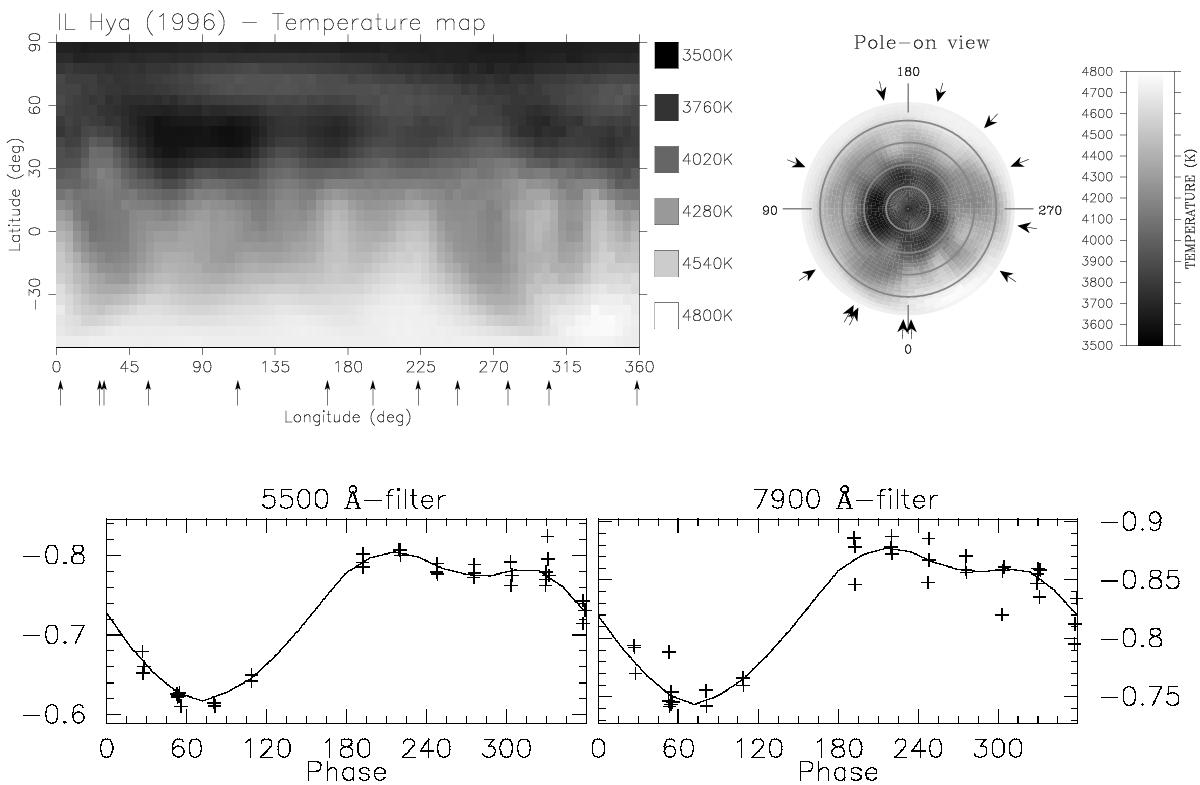
Surface temperature distribution of IL Hya from Doppler imaging in 1996. In this year the star was at about its medium brightness of the long-term change, marked in the upper panel of Fig. 1. Top left: Mercator projection of the temperature map. Top right: polar view of the temperature map. Bottom: contemporaneous V (5500 Å) and IC (7900 Å) light curves (plusses) and their fits (lines).
Current usage metrics show cumulative count of Article Views (full-text article views including HTML views, PDF and ePub downloads, according to the available data) and Abstracts Views on Vision4Press platform.
Data correspond to usage on the plateform after 2015. The current usage metrics is available 48-96 hours after online publication and is updated daily on week days.
Initial download of the metrics may take a while.