Fig. 1
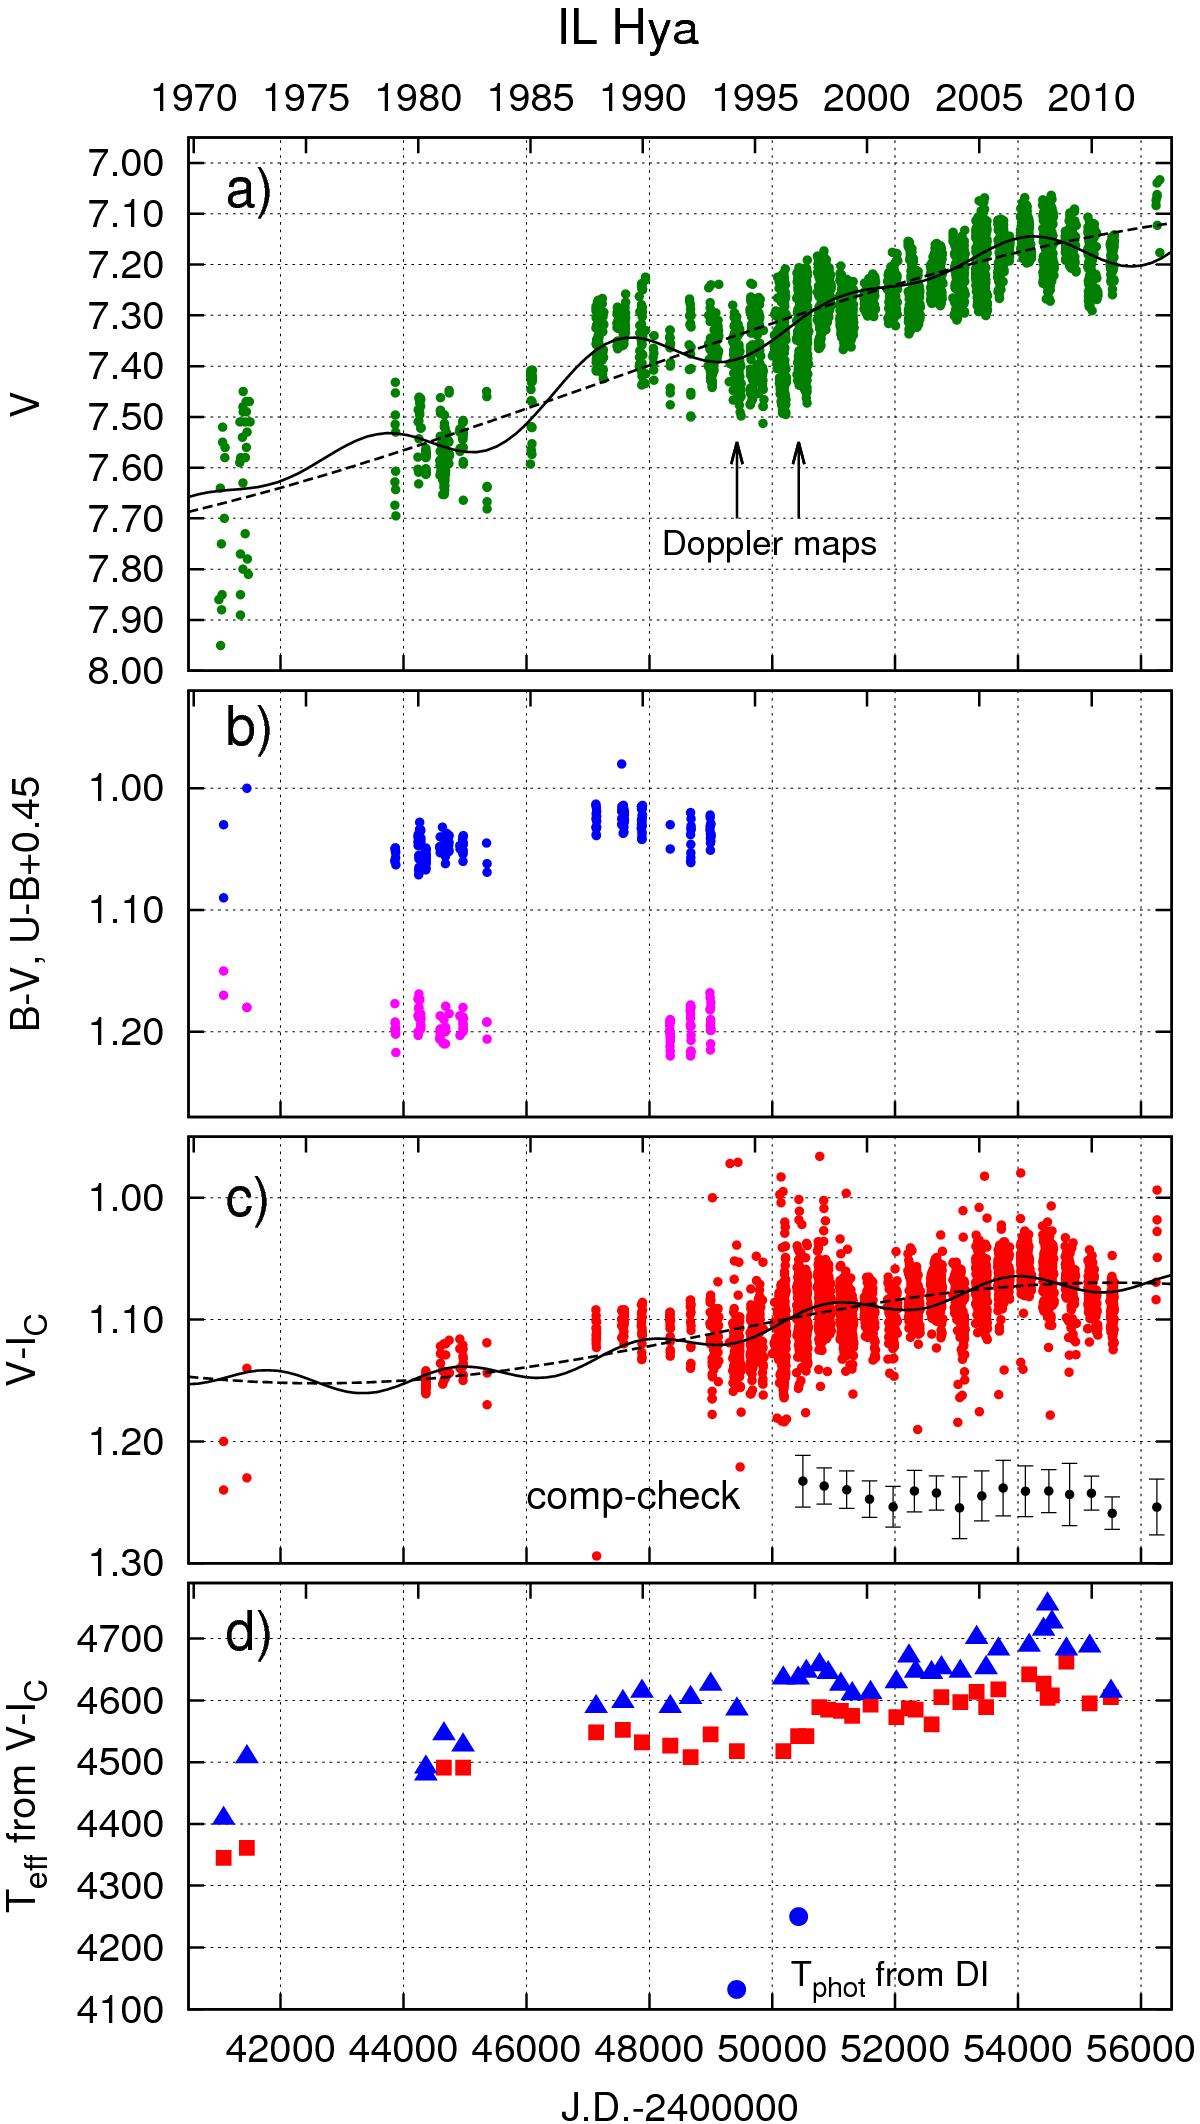
IL Hya light, color, and temperature curves. a) V data (dots) and their fits with a trend (dashed line; an artificial very long period fit), and with co-added modulations of timescales of 9 yr and 14 yr (line).The dates of the two Doppler images are indicated. b) B − V (upper dots) and U − B (lower dots). The U − B data were artificially shifted by +0![]() 45 for easier presentation. c) V − IC data (dots) and their fits with a trend (dashed line), and with co-added modulation of a marginally significant variability on a timescale of ≈7 yr (line). Seasonal average comp-check values are also plotted shifted by +1
45 for easier presentation. c) V − IC data (dots) and their fits with a trend (dashed line), and with co-added modulation of a marginally significant variability on a timescale of ≈7 yr (line). Seasonal average comp-check values are also plotted shifted by +1![]() 20 for easier presentation. d) Effective temperatures from V − IC at maxima (triangles) and minima (squares) of the light curves.
20 for easier presentation. d) Effective temperatures from V − IC at maxima (triangles) and minima (squares) of the light curves.
Current usage metrics show cumulative count of Article Views (full-text article views including HTML views, PDF and ePub downloads, according to the available data) and Abstracts Views on Vision4Press platform.
Data correspond to usage on the plateform after 2015. The current usage metrics is available 48-96 hours after online publication and is updated daily on week days.
Initial download of the metrics may take a while.