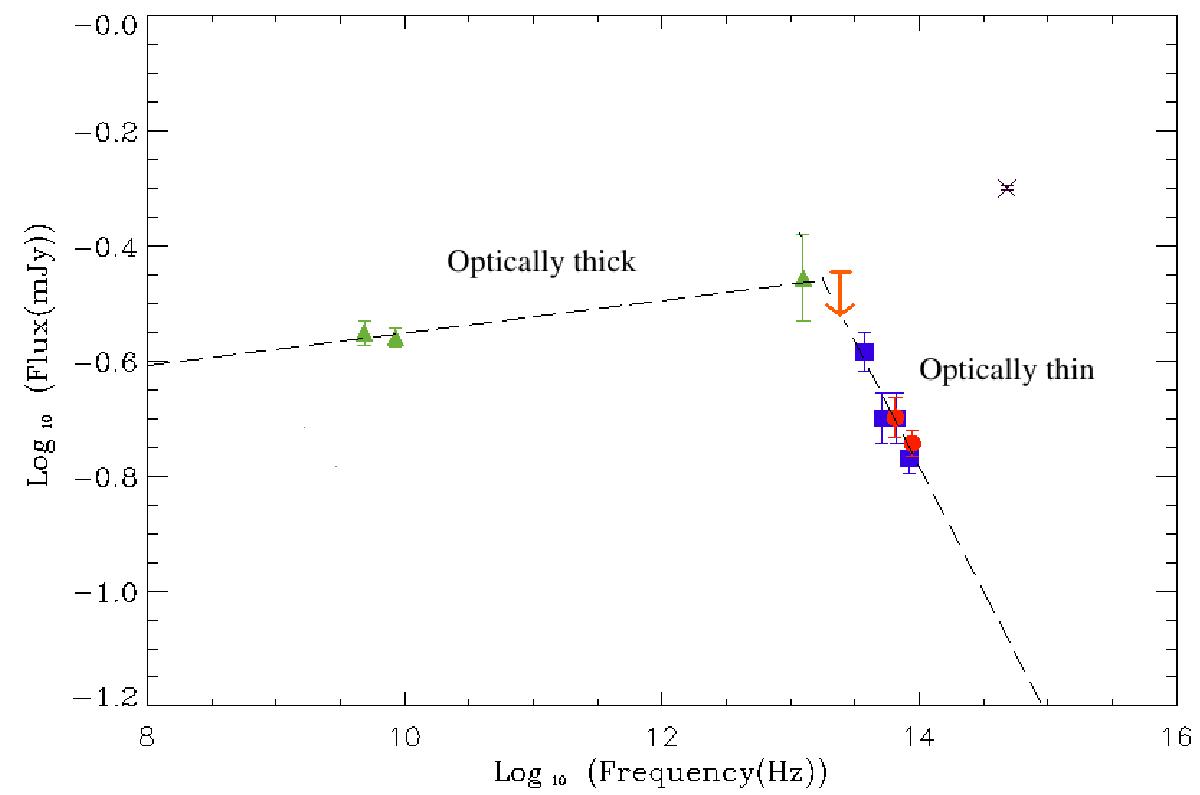
Fig. 6

Spectral energy distribution of the system 4U 0614+091 built starting from the radio (green triangles) and infrared points (blue squares) of Migliari et al. (2010), from the ALL WISE catalogue magnitudes (red circles) and from the r-flux obtained in this work (black x). With an orange arrow we indicated the W3-band WISE upper limit obtained from the ALLWise catalogue. Superimposed, the two linear fits of the SED. All the points are normalised to the fluxes of Migliari et al. (2010).
Current usage metrics show cumulative count of Article Views (full-text article views including HTML views, PDF and ePub downloads, according to the available data) and Abstracts Views on Vision4Press platform.
Data correspond to usage on the plateform after 2015. The current usage metrics is available 48-96 hours after online publication and is updated daily on week days.
Initial download of the metrics may take a while.


