Fig. 2
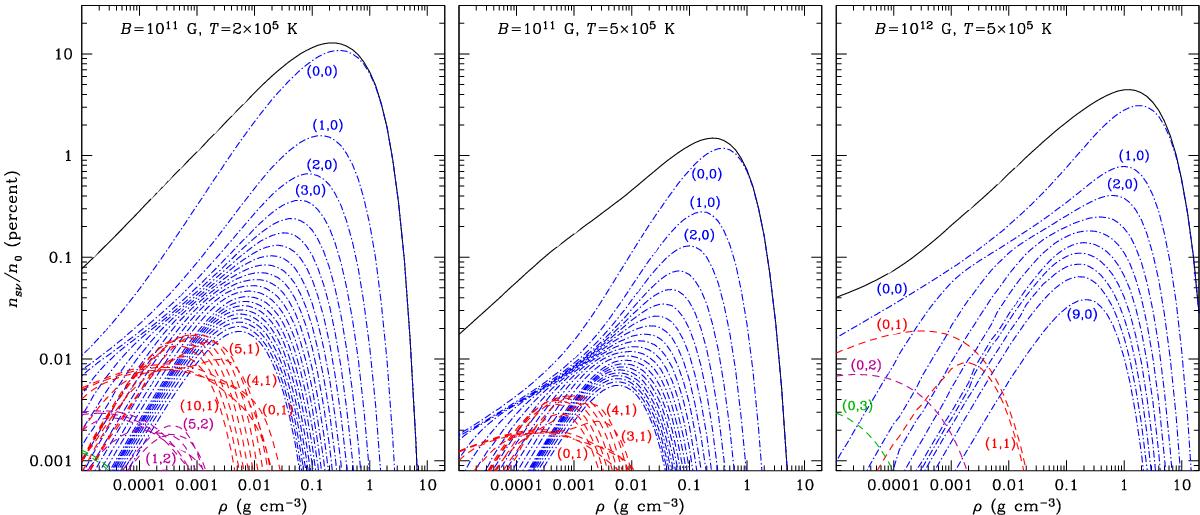
Fractional abundances of different nondissolved bound states (s,ν) with respect to the total number of electrons (free and bound), nsν/n0, as functions of mass density ρ, for B = 1011 G and T = 2 × 10⁵ K (left panel), B = 1011 G and T = 5 × 10⁵ K (middle panel), and B = 1012 G and T = 5 × 10⁵ K (right panel). The fractional abundances of tightly bound states (ν = 0) are plotted by dot-dashed lines, and loosely bound states (ν ≥ 1) by dashed lines. The solid lines show the total fractional abundance of the atoms that contribute to bound-bound and bound-free opacities.
Current usage metrics show cumulative count of Article Views (full-text article views including HTML views, PDF and ePub downloads, according to the available data) and Abstracts Views on Vision4Press platform.
Data correspond to usage on the plateform after 2015. The current usage metrics is available 48-96 hours after online publication and is updated daily on week days.
Initial download of the metrics may take a while.