Fig. 9
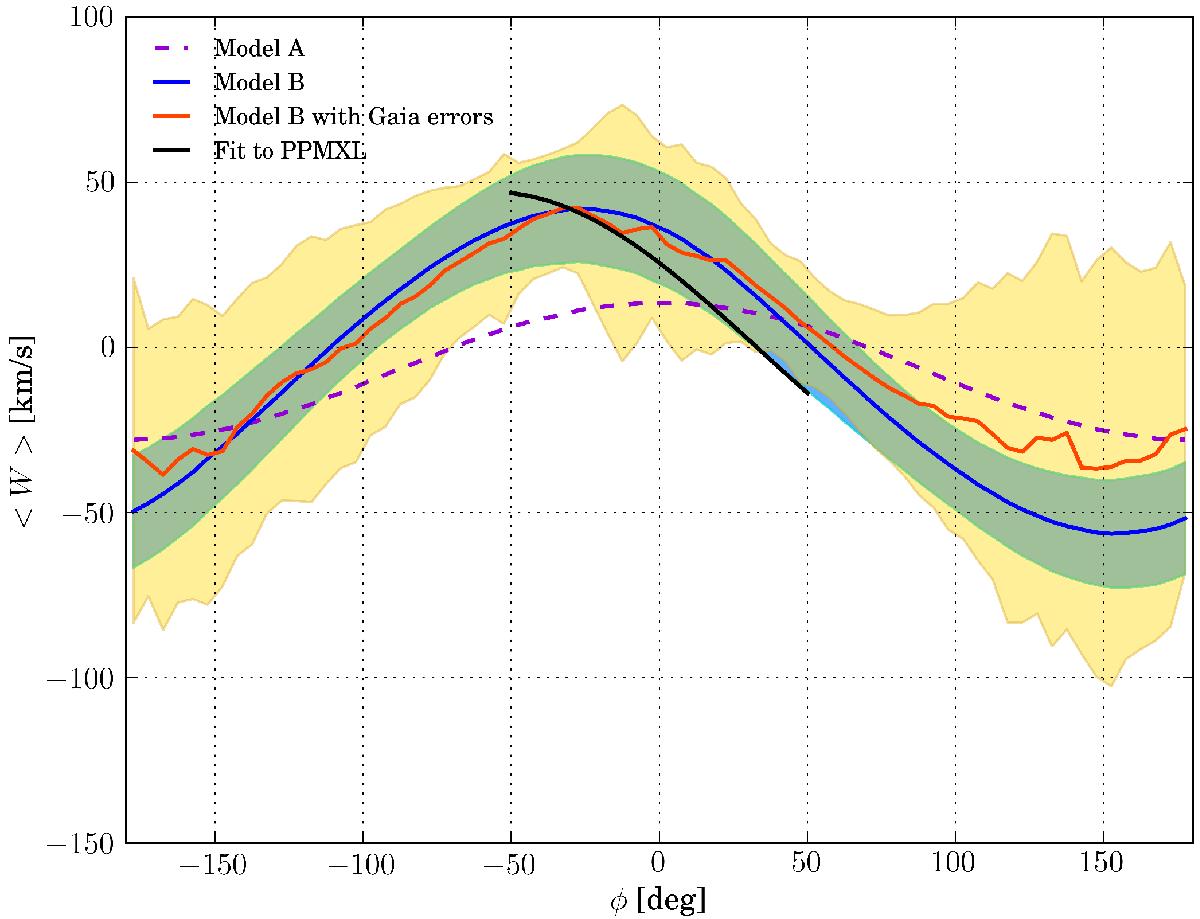
Mean W velocity component as a function of galactocentric azimuth for RC stars at 13 <R(kpc)< 14. RCGs simulated using models A and B are plotted as dashed purple and solid blue lines. The fit to PPMXL data is given in black, the same as the fit in Fig. 5 in the bottom-left panel. The Gaia “observed” values are plotted in red. The shaded regions in blue and yellow represents the standard deviations of the W velocity for model B without and with Gaia errors. The line of nodes is defined to coincide with the Sun-Galactic center line (φw = 0).
Current usage metrics show cumulative count of Article Views (full-text article views including HTML views, PDF and ePub downloads, according to the available data) and Abstracts Views on Vision4Press platform.
Data correspond to usage on the plateform after 2015. The current usage metrics is available 48-96 hours after online publication and is updated daily on week days.
Initial download of the metrics may take a while.