Fig. 1
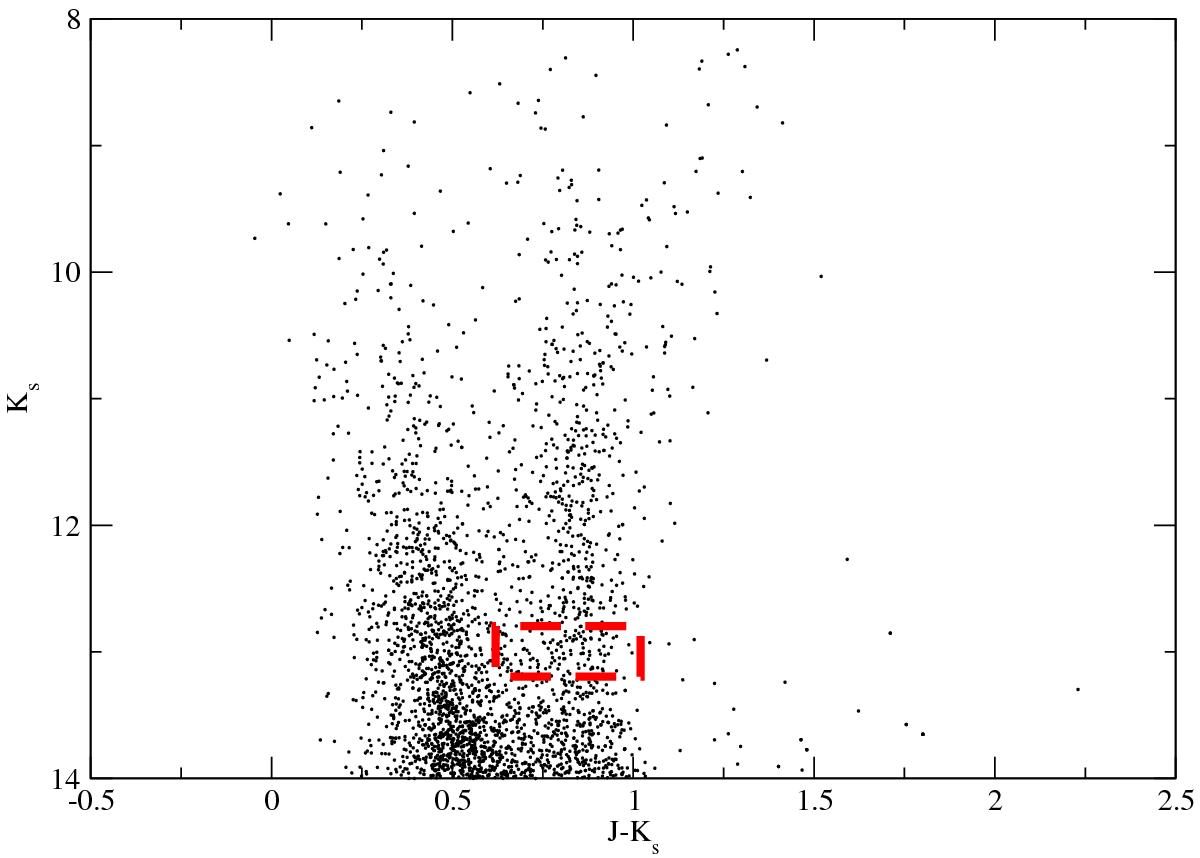
Example of applying the RCG selection from the PPMXL survey in a K vs. J − K color-magnitude diagram. This case is for the direction ℓ = 180°, b = 7°, at one particular K-magnitude mK,0 = 13.0, giving the highest counts within the RCG region at (J − K)0 = 0.81. The dashed rectangle represents the area where the RCGs are selected.
Current usage metrics show cumulative count of Article Views (full-text article views including HTML views, PDF and ePub downloads, according to the available data) and Abstracts Views on Vision4Press platform.
Data correspond to usage on the plateform after 2015. The current usage metrics is available 48-96 hours after online publication and is updated daily on week days.
Initial download of the metrics may take a while.