Fig. 12
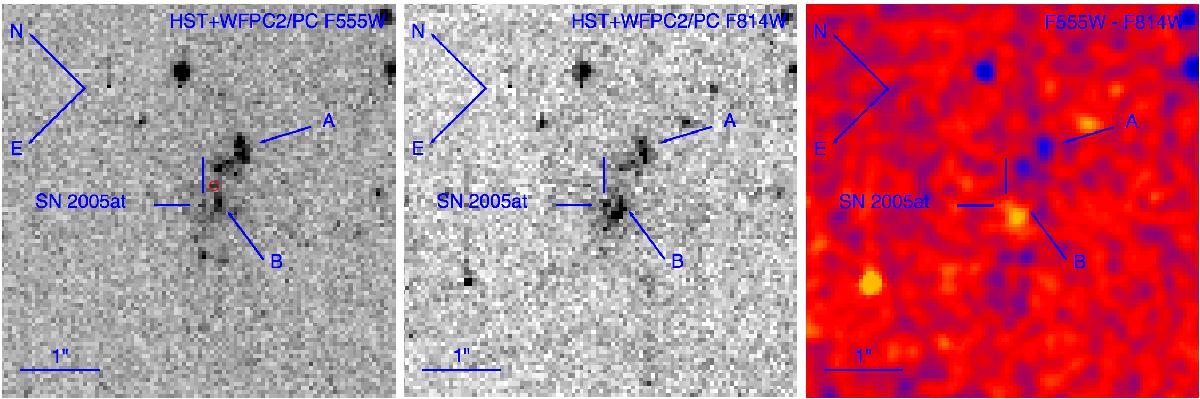
HST WFPC2/PC F555W a) and F814W b) images of the site of SN 2005at. The source which we associate with the SN is indicated by the tick marks, the extended sources A and B are also shown. The red circle shows the transformed position of the He ii source (Sect. 6.1). The F555W−F814W c) image has been Gaussian smoothed for illustration purposes. The different colours of sources A and B are evident. The scale and orientation of all three panels are identical and indicated in the panels on the right.
Current usage metrics show cumulative count of Article Views (full-text article views including HTML views, PDF and ePub downloads, according to the available data) and Abstracts Views on Vision4Press platform.
Data correspond to usage on the plateform after 2015. The current usage metrics is available 48-96 hours after online publication and is updated daily on week days.
Initial download of the metrics may take a while.