Fig. 7
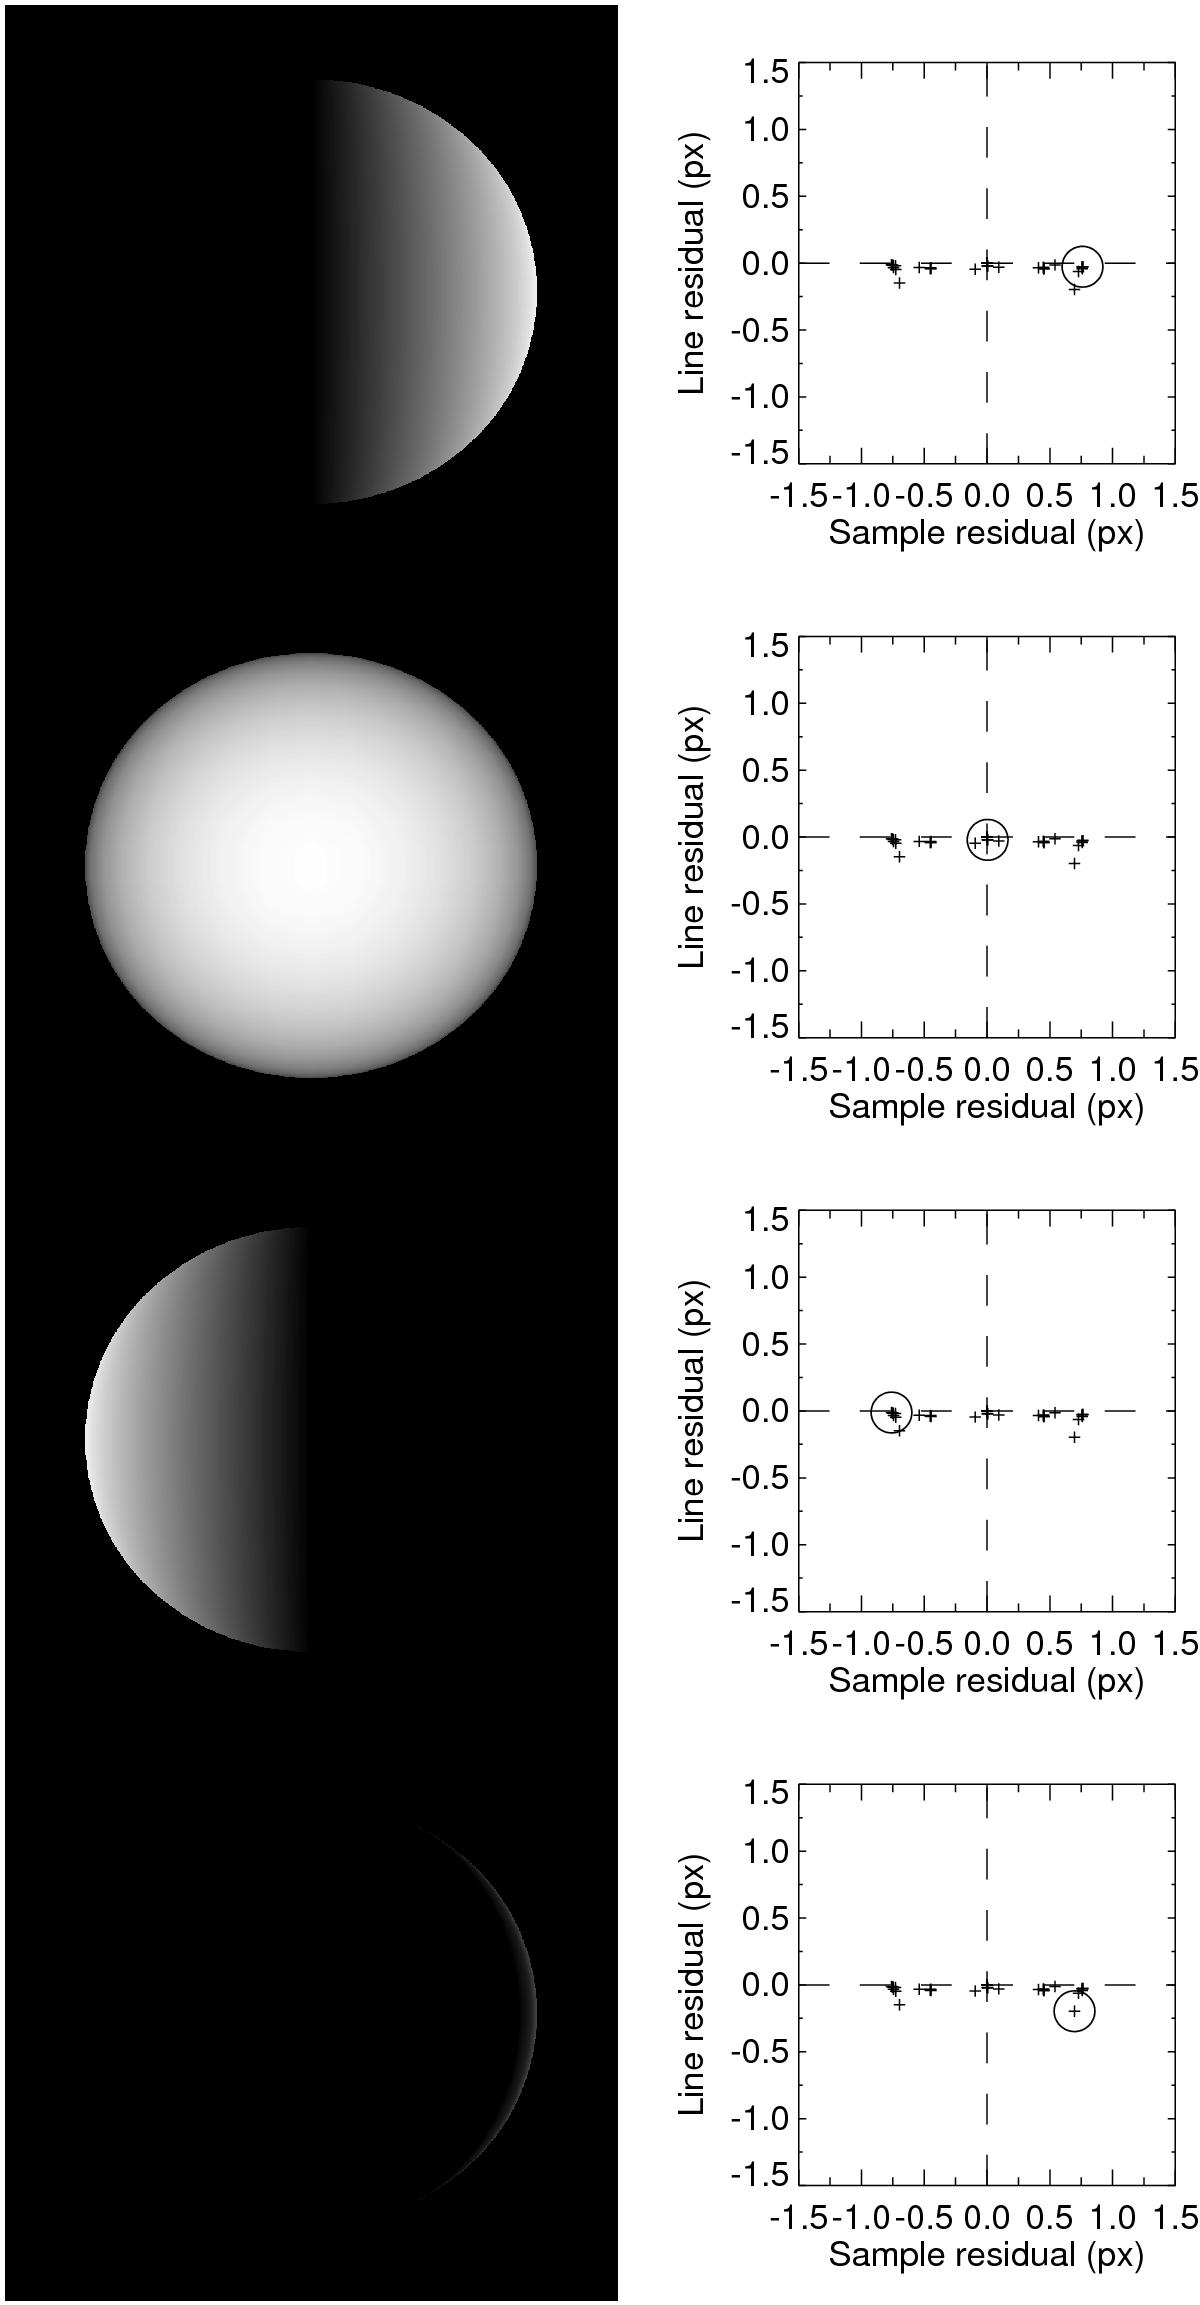
Synthetic images for different phase angles, showing O−C residuals in pixel (right) for centre-of figure positions measured by limb-fitting the images shown left. The maximum bias occurs for 90 degree phase and is zero for zero phase. All points in the right-hand displays are the same, with the particular O−C residual values corresponding to each of the four images represented by the small circles (phase angles are, from top to bottom, +90 deg, 0 deg, –90 deg, 180 deg).
Current usage metrics show cumulative count of Article Views (full-text article views including HTML views, PDF and ePub downloads, according to the available data) and Abstracts Views on Vision4Press platform.
Data correspond to usage on the plateform after 2015. The current usage metrics is available 48-96 hours after online publication and is updated daily on week days.
Initial download of the metrics may take a while.