Fig. 1
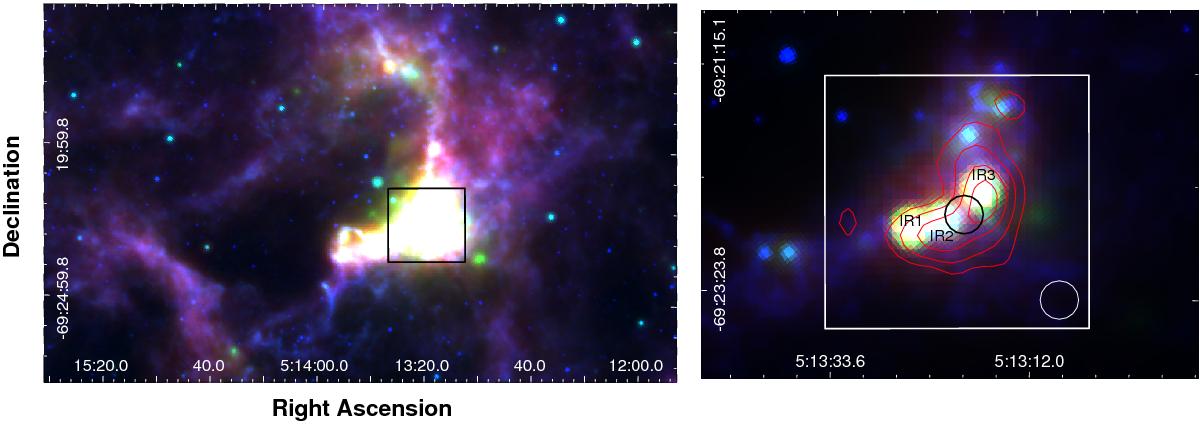
Left: three-colour image where the 8, 24, and 70 μm emission obtained from the IRAC and MIPS cameras of the Spitzer Space Telescope (from SAGE Spitzer; Meixner et al. 2006) are presented in blue, green, and red, respectively. The black box shows the region mapped in the 13CO J = 3 − 2 line with an angular resolution of 22′′. Right: zoom-in of the mapped region (white box). The colour code is the same as in the left image, but the scales are different. The red contours correspond to the 13CO J = 3 − 2 emission integrated between 230 and 245 km s-1 with levels of 2.5, 4.0, 6.0, and 8.0 K km s-1. The FWHM beam size of the observations is included in the bottom right corner of the region. The black circle corresponds to the position where the 16 molecular lines were observed as single pointings.
Current usage metrics show cumulative count of Article Views (full-text article views including HTML views, PDF and ePub downloads, according to the available data) and Abstracts Views on Vision4Press platform.
Data correspond to usage on the plateform after 2015. The current usage metrics is available 48-96 hours after online publication and is updated daily on week days.
Initial download of the metrics may take a while.