Fig. 9
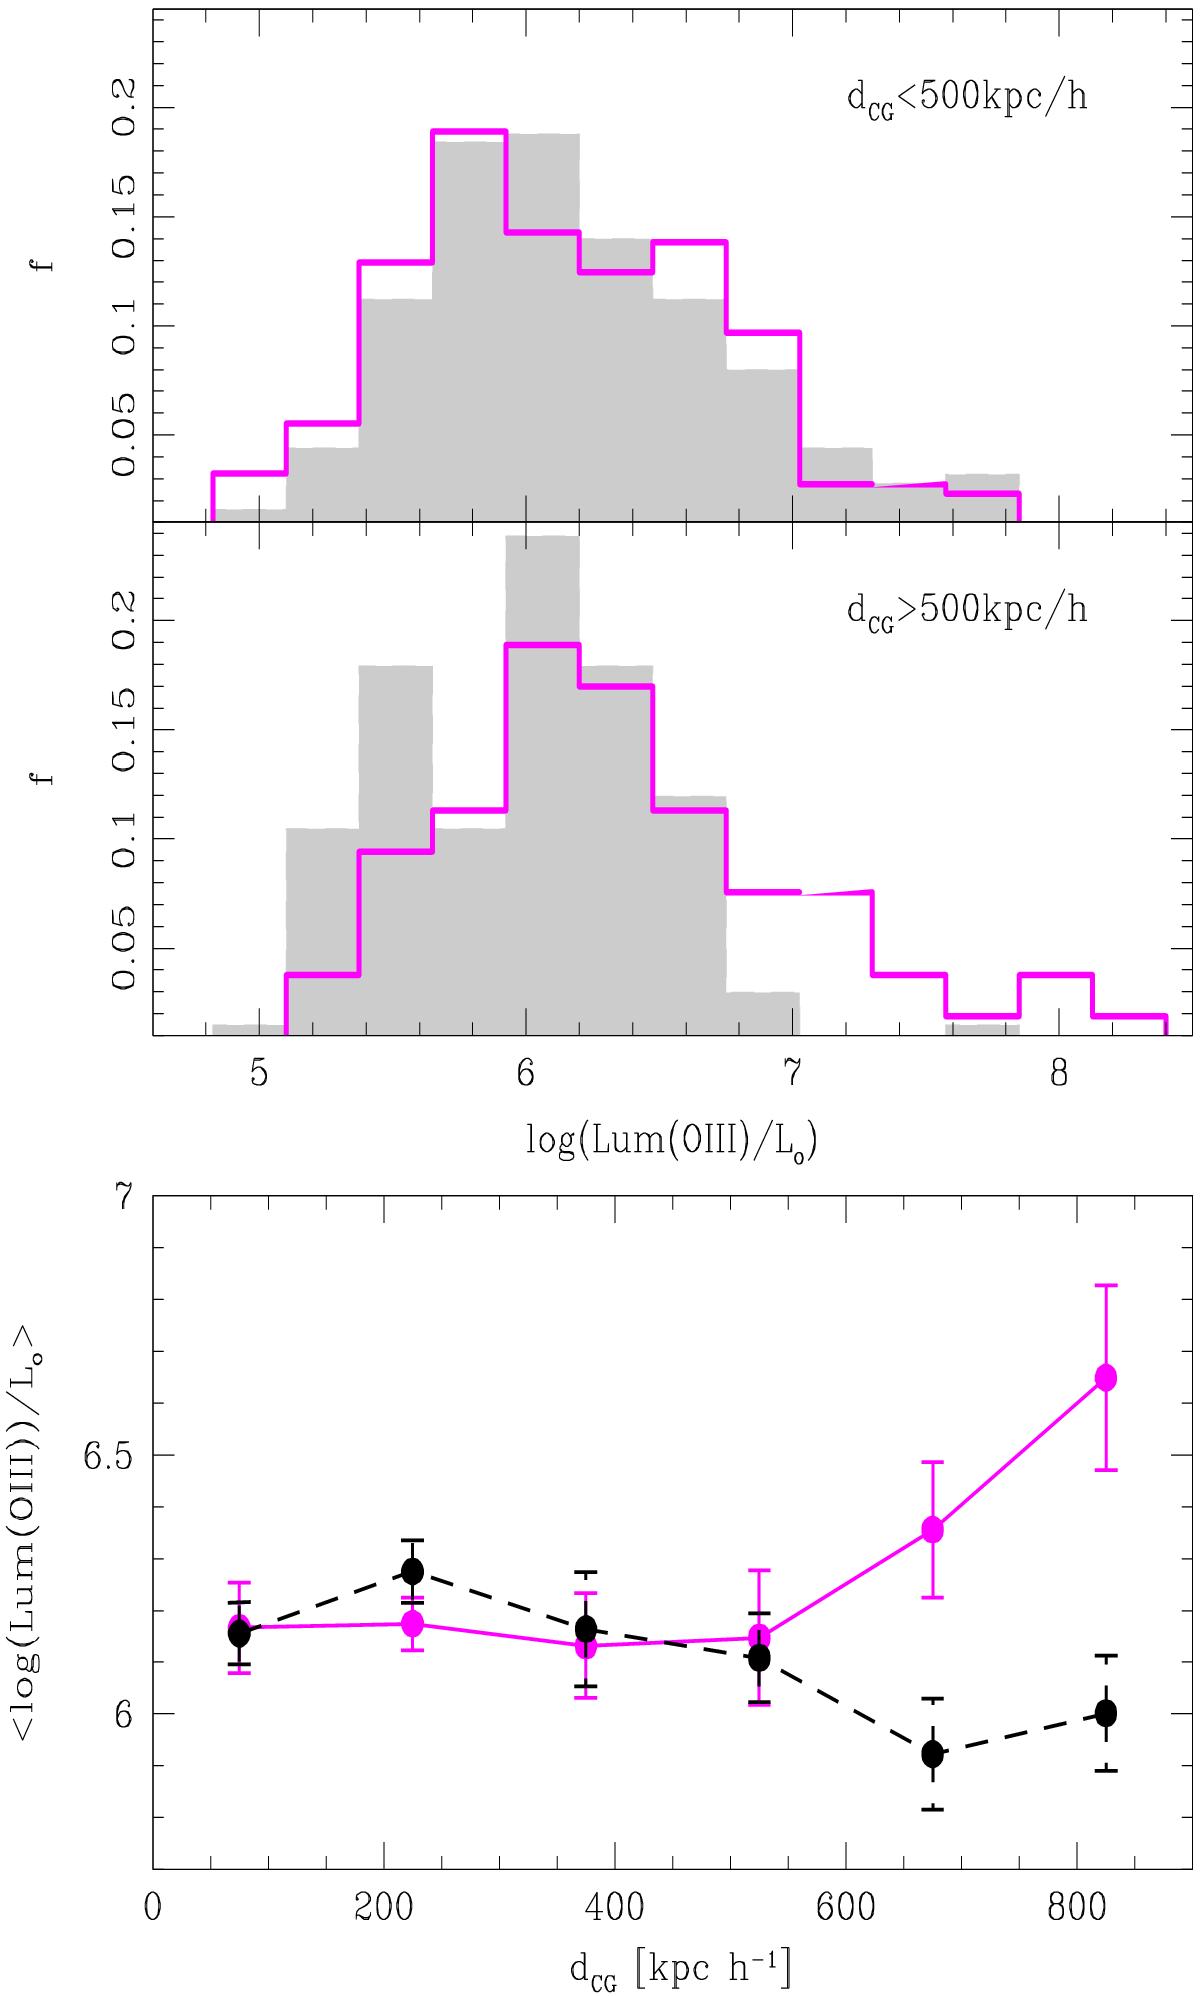
Distributions of log (Lum [OIII] /L⊙) for barred AGN (solid lines) and unbarred active galaxies (full surfaces) with different group-centric distances: dCG< 500 kpc h-1 and dCG> 500 kpc h-1 (upper and middle panels, respectively). Lower panel shows mean ⟨ log (Lum(OIII) /L⊙) ⟩ as a function of group-centric distance, dCG, for AGN galaxies with and without bars in groups (solid and dashed lines, respectively).
Current usage metrics show cumulative count of Article Views (full-text article views including HTML views, PDF and ePub downloads, according to the available data) and Abstracts Views on Vision4Press platform.
Data correspond to usage on the plateform after 2015. The current usage metrics is available 48-96 hours after online publication and is updated daily on week days.
Initial download of the metrics may take a while.