Fig. 7
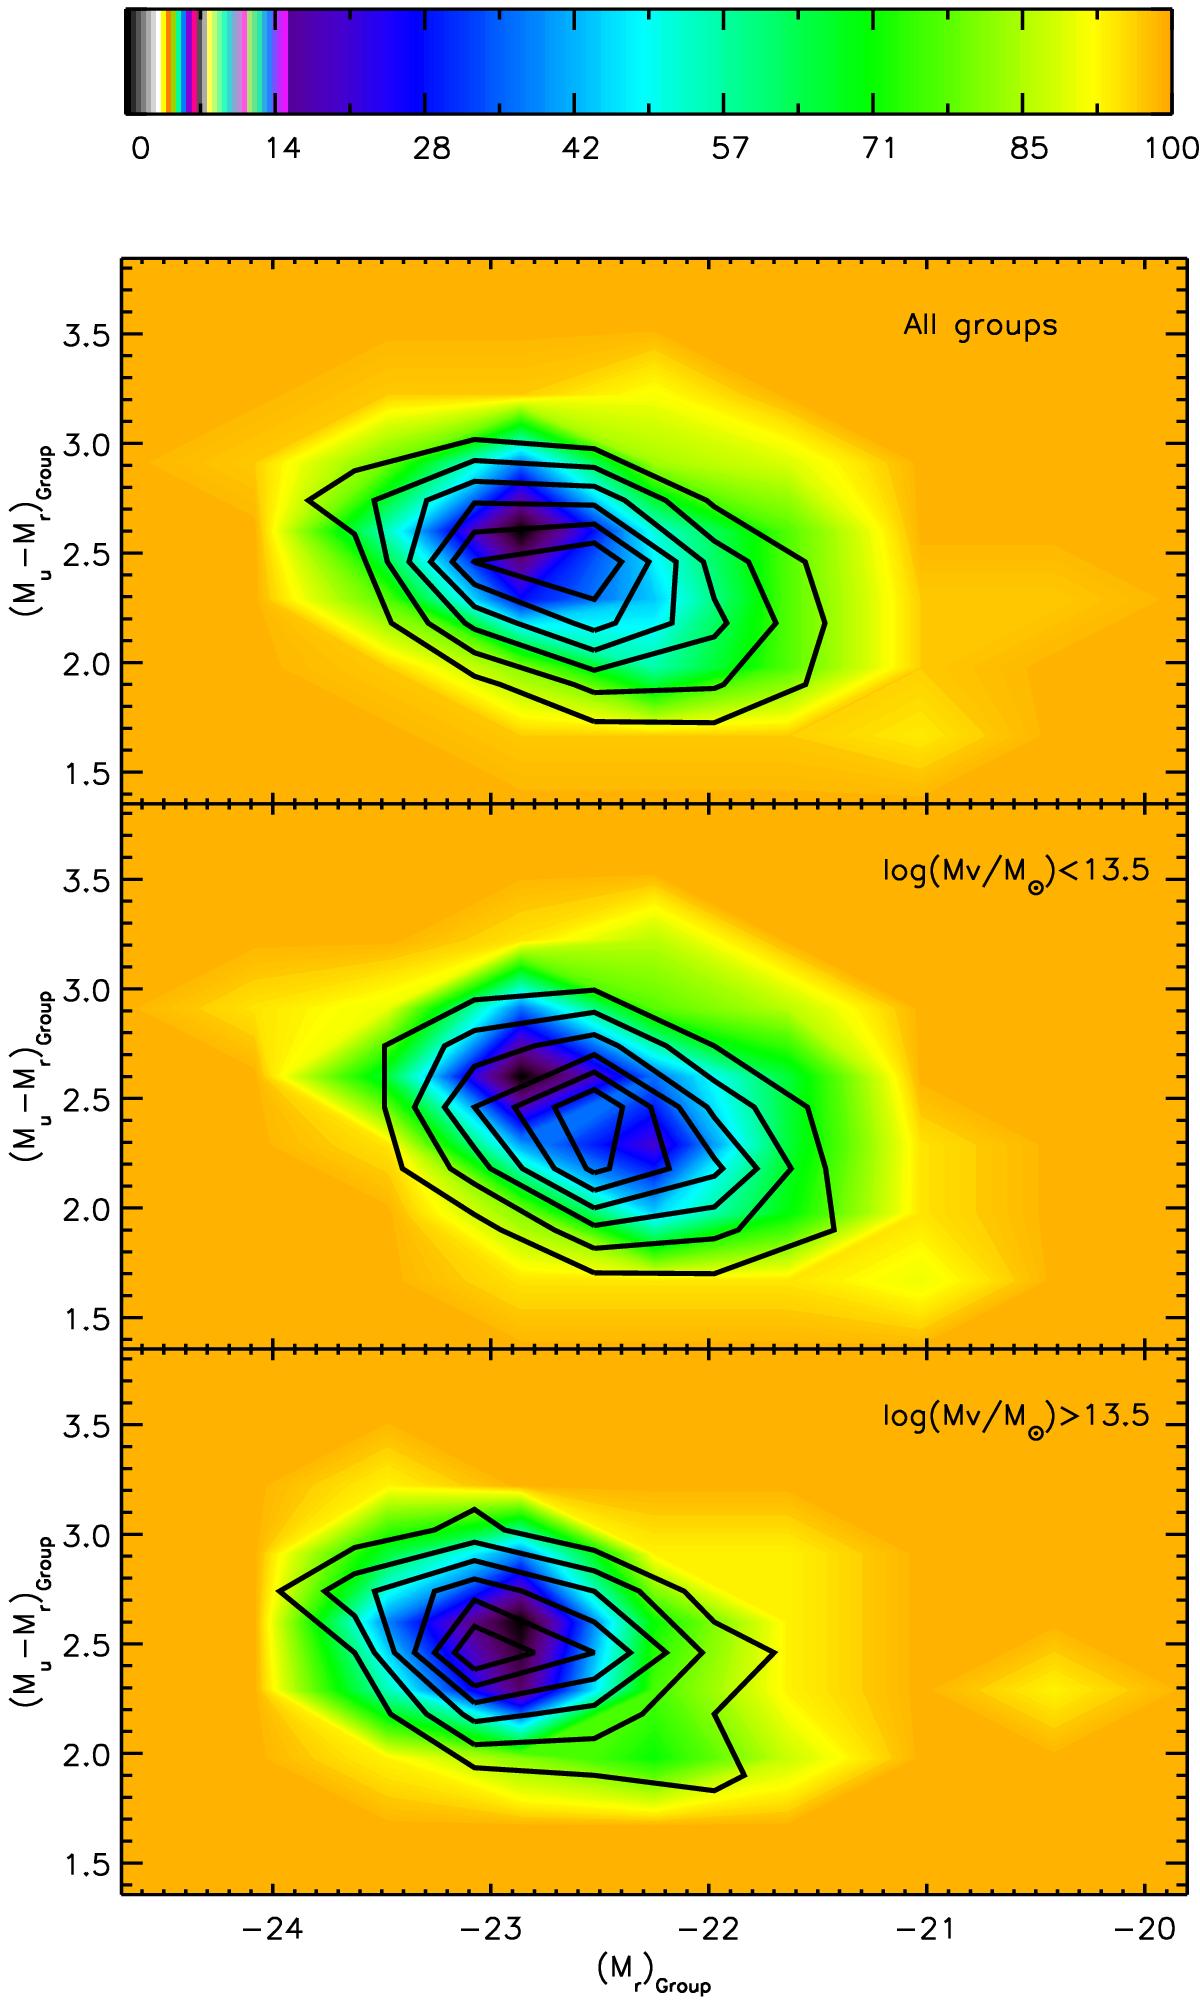
Color–magnitude diagrams (Mu − Mr)Group versus (Mr)Group. The density map shows the host groups of barred AGN (color scale corresponding to the cumulative percentage of objects, as shown in the key). For comparison, the black solid lines enclose 14%, 28%, 42%, 57%, 71%, and 85% of the host groups of unbarred AGN in the control sample. Middle and lower panels show host groups with different ranges of virial masses: MVirial< 1013.5M⊙ and MVirial> 1013.5M⊙, respectively.
Current usage metrics show cumulative count of Article Views (full-text article views including HTML views, PDF and ePub downloads, according to the available data) and Abstracts Views on Vision4Press platform.
Data correspond to usage on the plateform after 2015. The current usage metrics is available 48-96 hours after online publication and is updated daily on week days.
Initial download of the metrics may take a while.