Free Access
Fig. 3
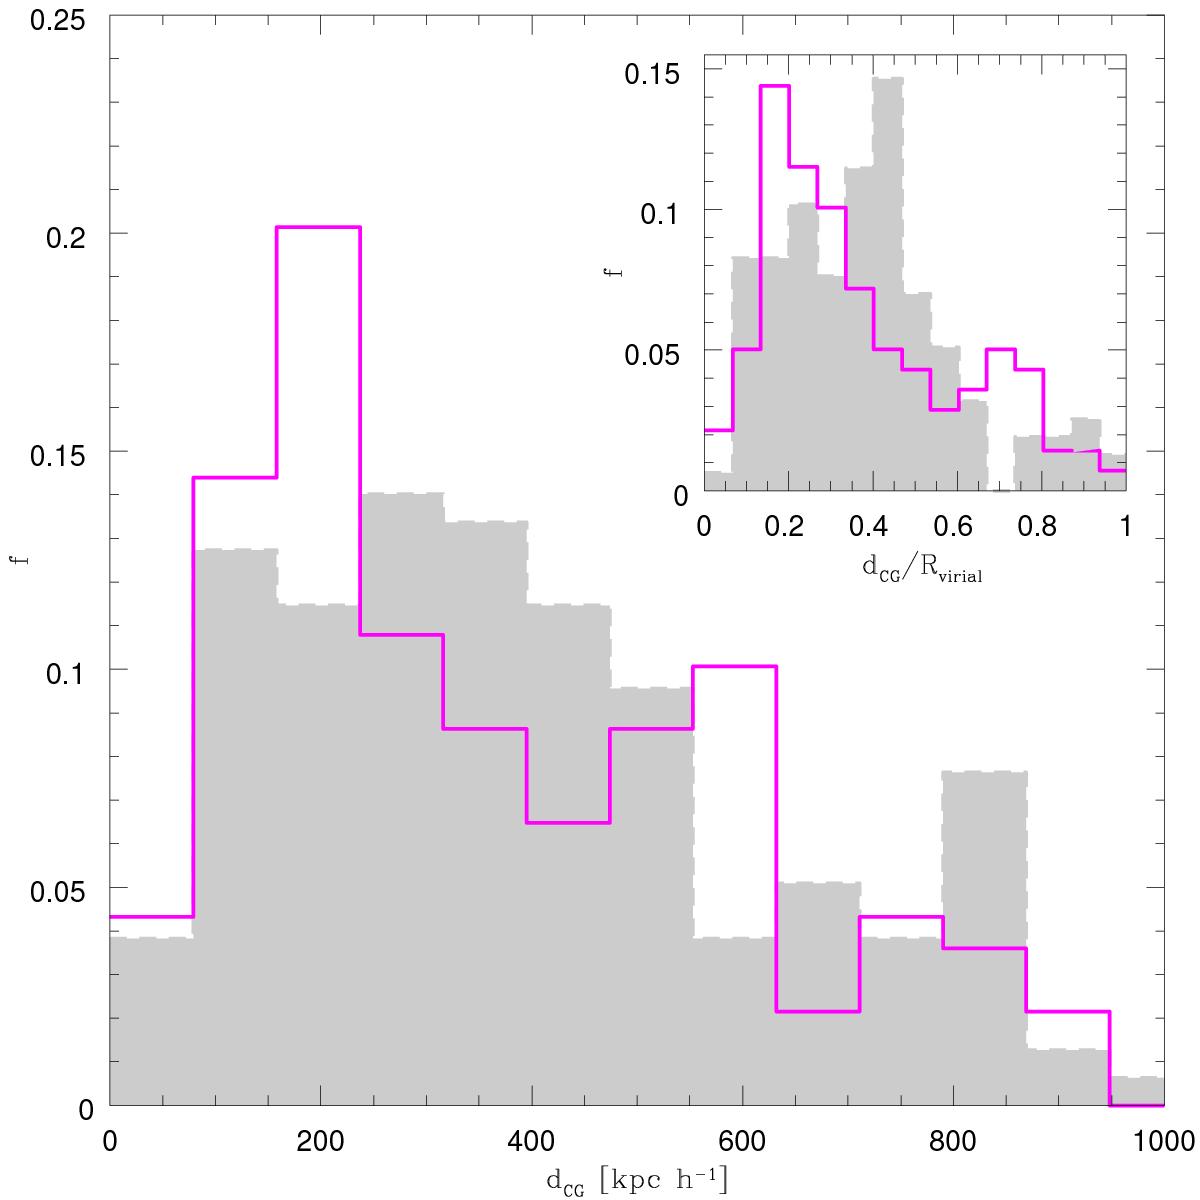
Distributions of group-centric galaxy distances, dCG, for barred AGN (solid lines) and unbarred AGN (full surface) in the control sample. The inset shows to the distribution of the normalized group-centric distance, dCG/RVirial, in the same samples.
Current usage metrics show cumulative count of Article Views (full-text article views including HTML views, PDF and ePub downloads, according to the available data) and Abstracts Views on Vision4Press platform.
Data correspond to usage on the plateform after 2015. The current usage metrics is available 48-96 hours after online publication and is updated daily on week days.
Initial download of the metrics may take a while.