Fig. 4
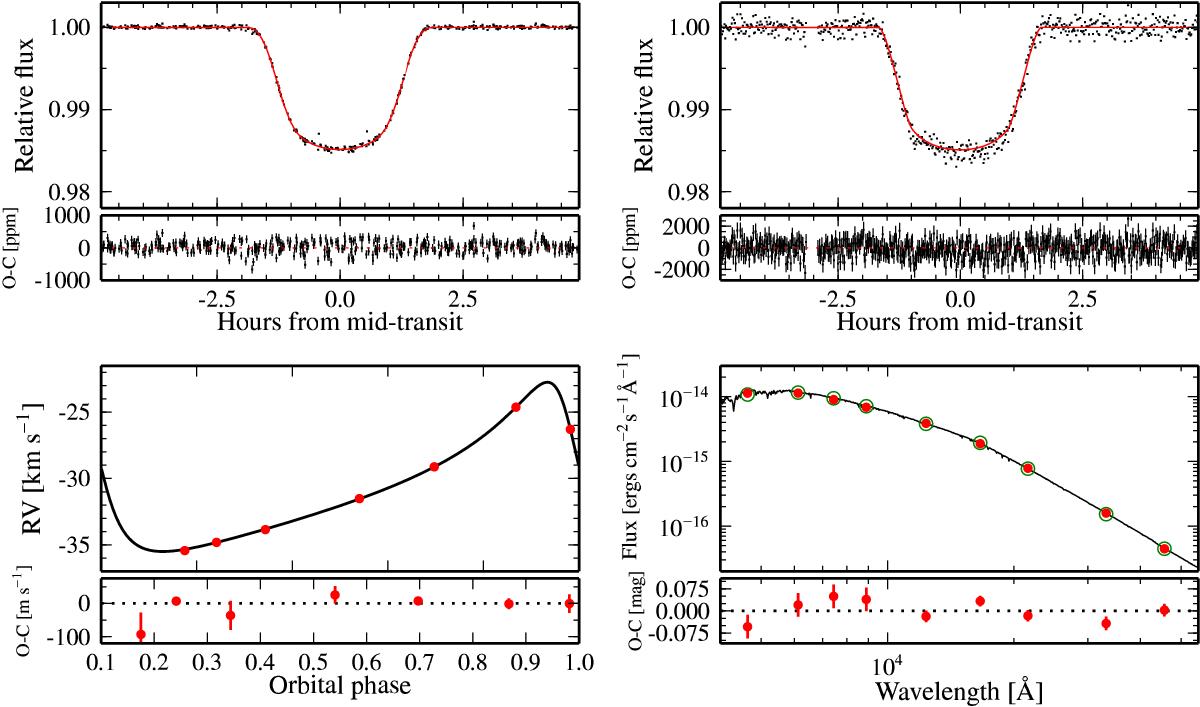
Data and best-fit model for KOI-686. Top row: phase-folded Kepler LC (left) and SC (right) light curves. Bottom row: SOPHIE RV curve (left), and spectral energy distribution (right). The Kepler data are corrected for contamination and normalized to the out-of-transit flux listed in Table 7. The model of the Kepler LC data is shown binned down to the data sampling rate. For the SED, the best-fit spectrum is plotted as a solid black curve, and the integrated fluxes in the photometric bands are plotted as open circles.
Current usage metrics show cumulative count of Article Views (full-text article views including HTML views, PDF and ePub downloads, according to the available data) and Abstracts Views on Vision4Press platform.
Data correspond to usage on the plateform after 2015. The current usage metrics is available 48-96 hours after online publication and is updated daily on week days.
Initial download of the metrics may take a while.