Fig. 2
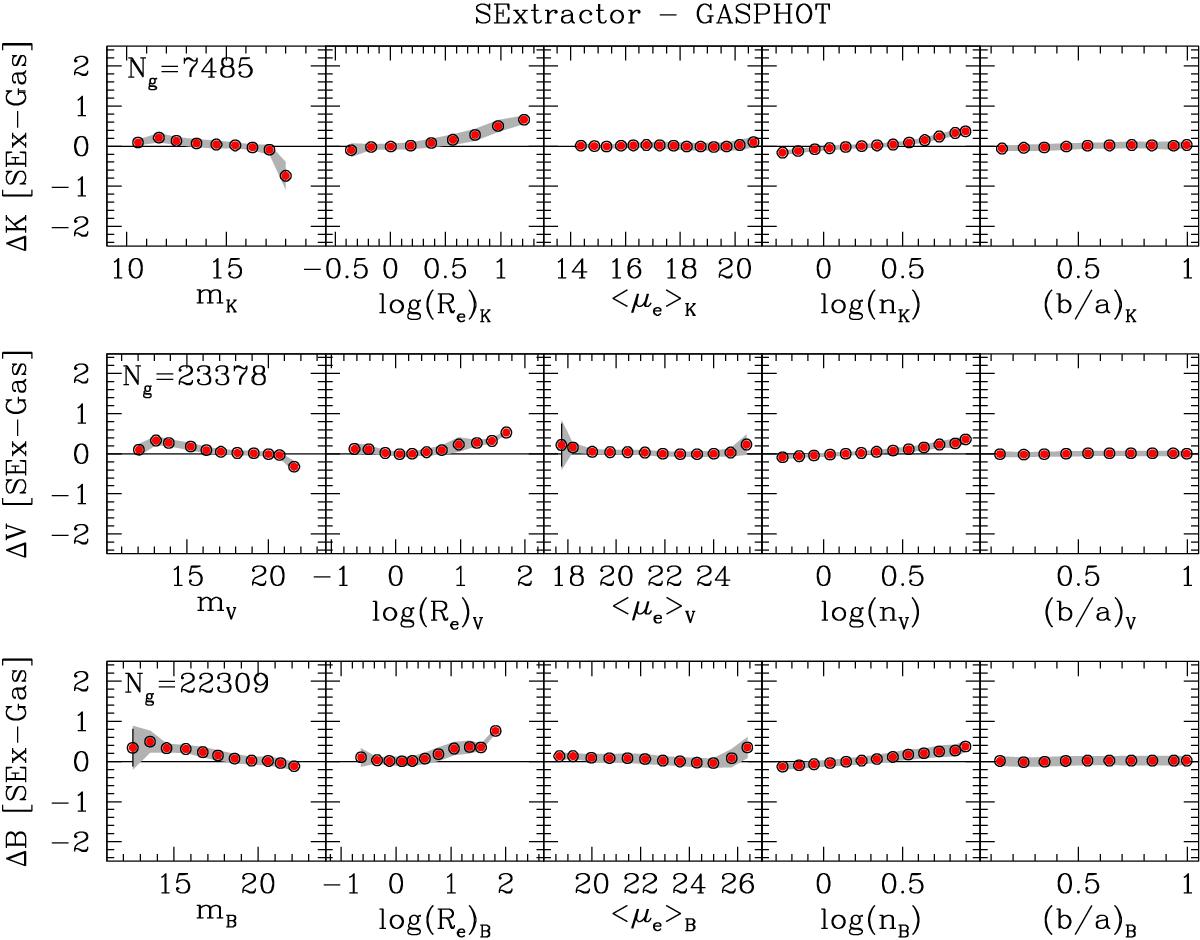
Median total magnitude differences between SExtractor and GASPHOT in the K, V, and B band (top to bottom) binned as a function of the absolute magnitude, the effective radius and surface brightness, the Sersic index, and the axis ratio derived by GASPHOT (left to right). The error bars represent the uncertainties of the median values in each bin, while the shaded bands give the semi-interquartile ranges of the deviation distributions. Both quantities are very small (comparable with the size of the points). The sizes of the samples used for the comparisons are reported in the leftmost panel for each filter.
Current usage metrics show cumulative count of Article Views (full-text article views including HTML views, PDF and ePub downloads, according to the available data) and Abstracts Views on Vision4Press platform.
Data correspond to usage on the plateform after 2015. The current usage metrics is available 48-96 hours after online publication and is updated daily on week days.
Initial download of the metrics may take a while.