Fig. 2
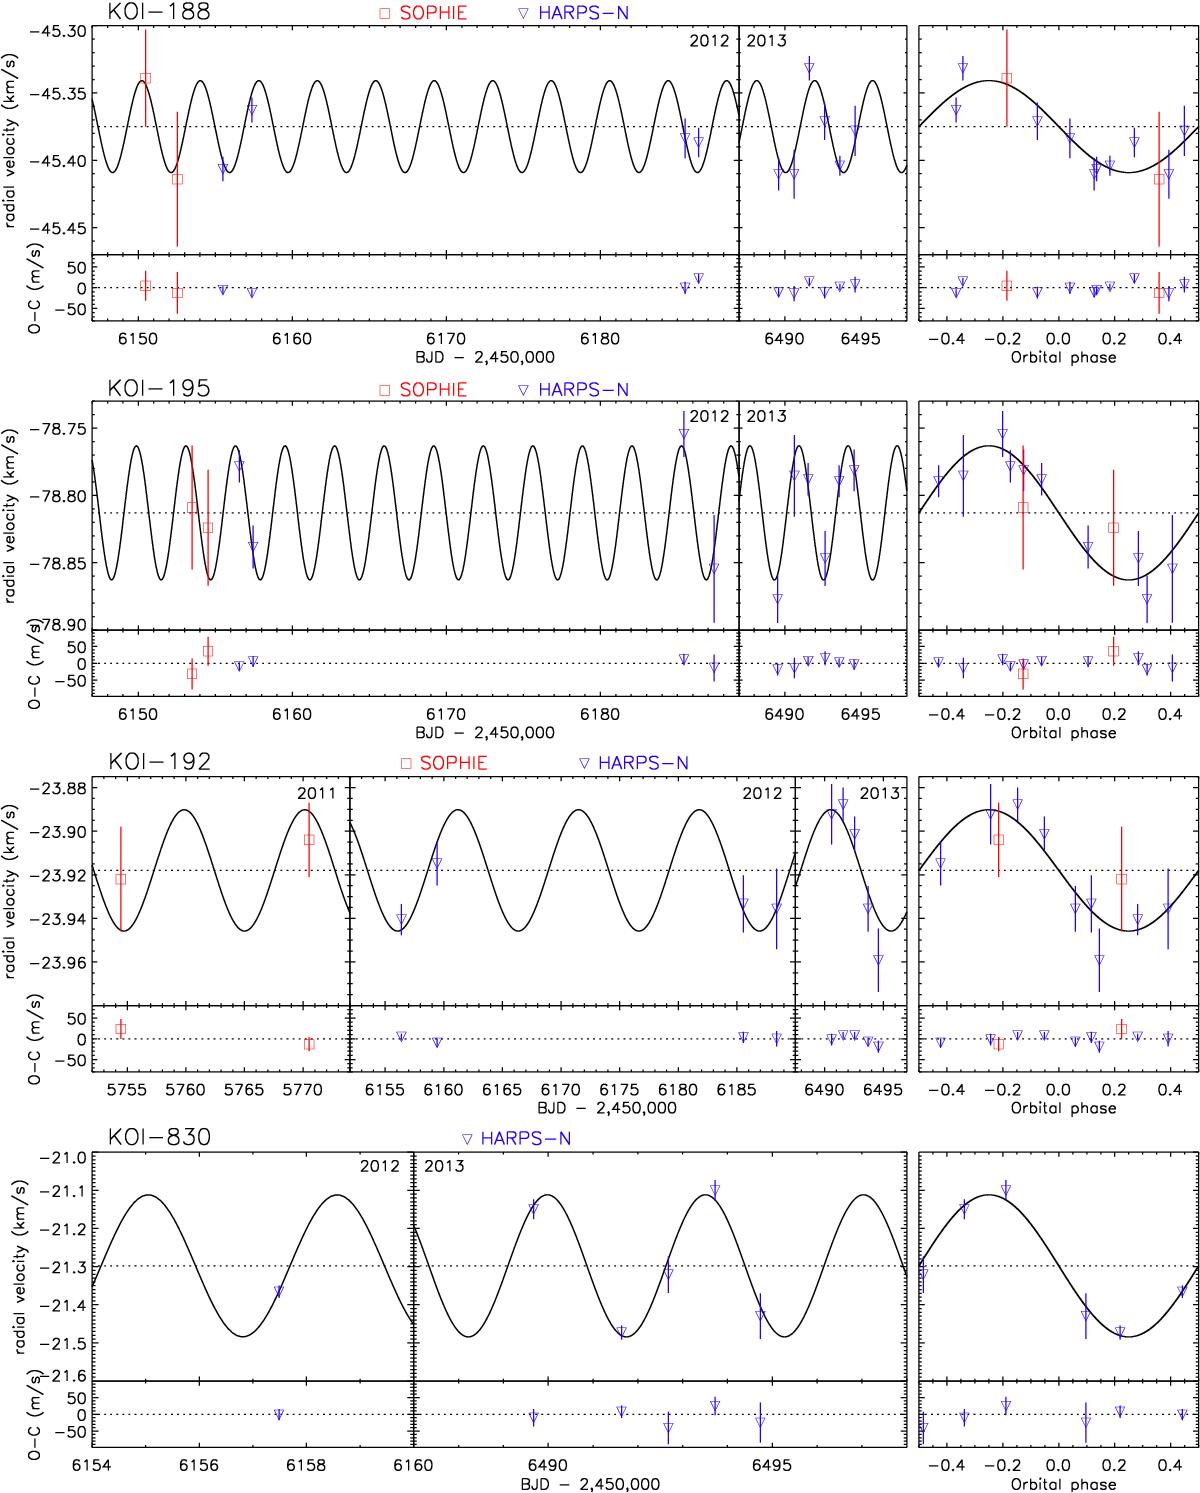
Radial velocities of the four planet-host stars, from HARPS-N (blue) and SOPHIE (red), and 1σ error bars. On each of the four plots, the left panel shows the radial velocities as a function of time, the right panel shows the phase-folded data, the upper panel shows the data over-plotted with the best circular model (black line), and the lower panel shows the residuals. The parameters of the fits are given in Tables 4 and 5.
Current usage metrics show cumulative count of Article Views (full-text article views including HTML views, PDF and ePub downloads, according to the available data) and Abstracts Views on Vision4Press platform.
Data correspond to usage on the plateform after 2015. The current usage metrics is available 48-96 hours after online publication and is updated daily on week days.
Initial download of the metrics may take a while.