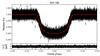
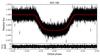
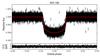
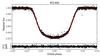
Fig. 1

Kepler photometric data of the four planet-host stars. On each plot the upper panel shows the phase-folded light-curve (black dots with 1σ error bars) over-plotted with the best model (red line; see Sect. 3.2), and the lower panel shows the residuals. The models fit together the photometric data, the radial velocities, and the spectral energy distribution (Table 3 and Fig. 2). The parameters of the fits are reported in Tables 4 and 5. Only Kepler short-cadence data are plotted here for KOI-188, KOI-195, and KOI-192, but long-cadence data are also used in the analysis of these three systems. No short-cadence data are available for KOI-830, whose long-cadence data are plotted here.
Current usage metrics show cumulative count of Article Views (full-text article views including HTML views, PDF and ePub downloads, according to the available data) and Abstracts Views on Vision4Press platform.
Data correspond to usage on the plateform after 2015. The current usage metrics is available 48-96 hours after online publication and is updated daily on week days.
Initial download of the metrics may take a while.