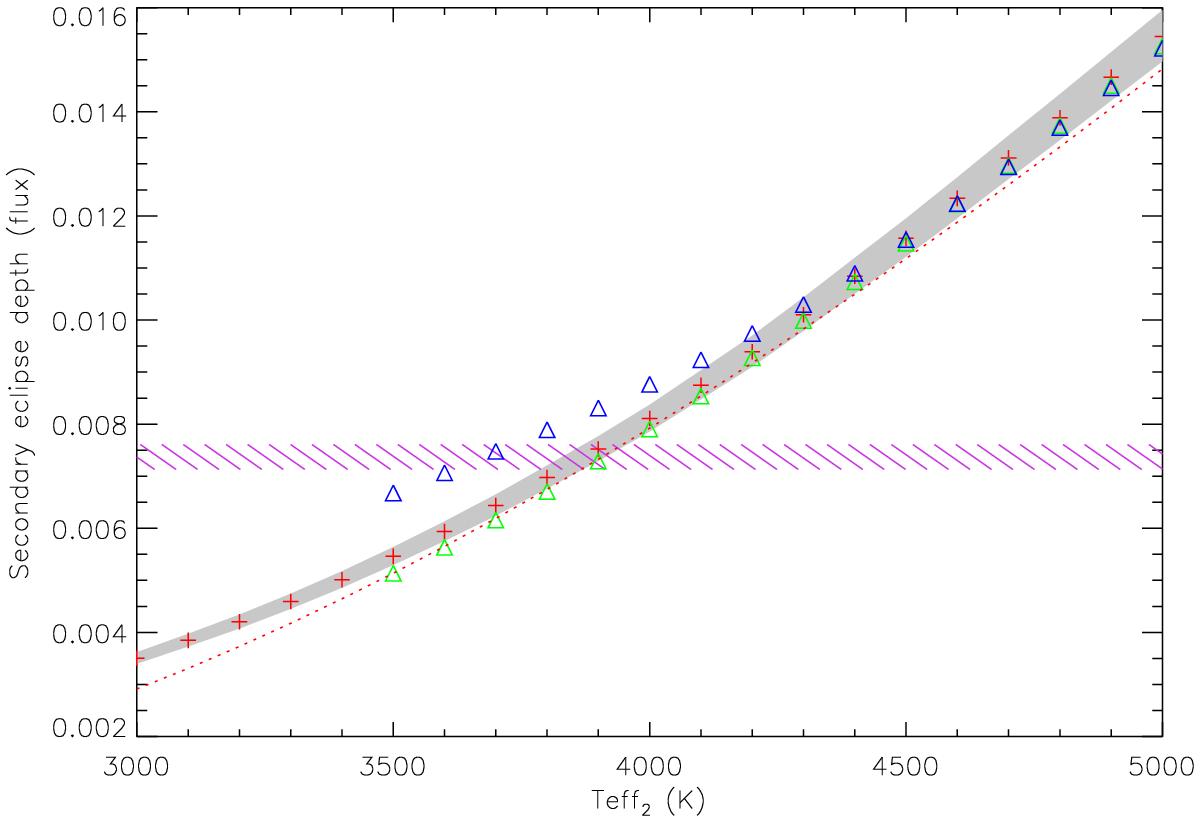
Fig. 7

Expected secondary eclipse depth based on the latest PHOENIX stellar atmospheres from Husser et al. (2013). The magenta-lined area marks the measured depth of the secondary eclipse from our NIR light curve, 0.00737±0.00024 in flux. The red crosses denote the expected secondary eclipse depth when assuming [Fe/H] = −0.5 dex, Teff,1 = 6000 K, log g1 = 4.00 dex, log g2 = 5.00 dex, and no alpha element enhancement, and the grey area denotes an uncertainty in the primary temperature of 100 K. The triangles are similar to the crosses, except that they represent different alpha enhancement levels for both components: the blue triangles are for α = + 1.2 dex, and the green triangles are for α = −0.2 dex. The red dotted line is the expected eclipse when using black bodies instead of the model atmospheres. Even the highest alpha element enhancement considered by the PHOENIX model atmospheres is not enough to reconcile the simulated secondary eclipse depth for the Teff,2 that is expected from evolutionary models with our measurement of the secondary eclipse.
Current usage metrics show cumulative count of Article Views (full-text article views including HTML views, PDF and ePub downloads, according to the available data) and Abstracts Views on Vision4Press platform.
Data correspond to usage on the plateform after 2015. The current usage metrics is available 48-96 hours after online publication and is updated daily on week days.
Initial download of the metrics may take a while.


