Fig. 4
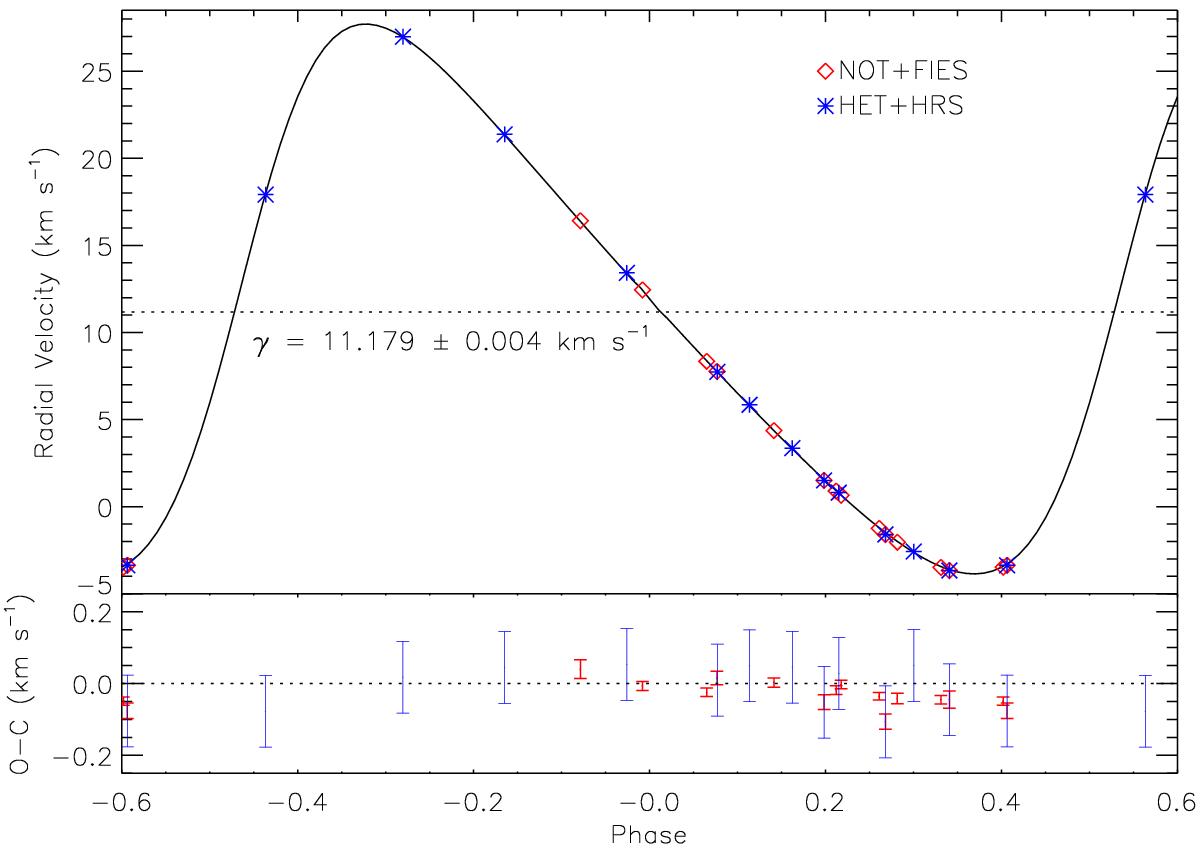
Primary radial velocity curve. We show the radial velocities describing the motion of the primary star around the system’s centre of mass. The best fit model (Sects. 3.3 to 3.5) is shown by the continuous (black) line with the systemic velocity given by the dotted line; the RV measurements acquired at the NOT are denoted by red diamonds and the HET data are shown with blue asterisks. The bottom panel shows the residuals to the fit and the uncertainties of the individual RVs.
Current usage metrics show cumulative count of Article Views (full-text article views including HTML views, PDF and ePub downloads, according to the available data) and Abstracts Views on Vision4Press platform.
Data correspond to usage on the plateform after 2015. The current usage metrics is available 48-96 hours after online publication and is updated daily on week days.
Initial download of the metrics may take a while.