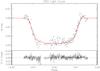
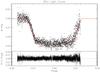
Fig. 2
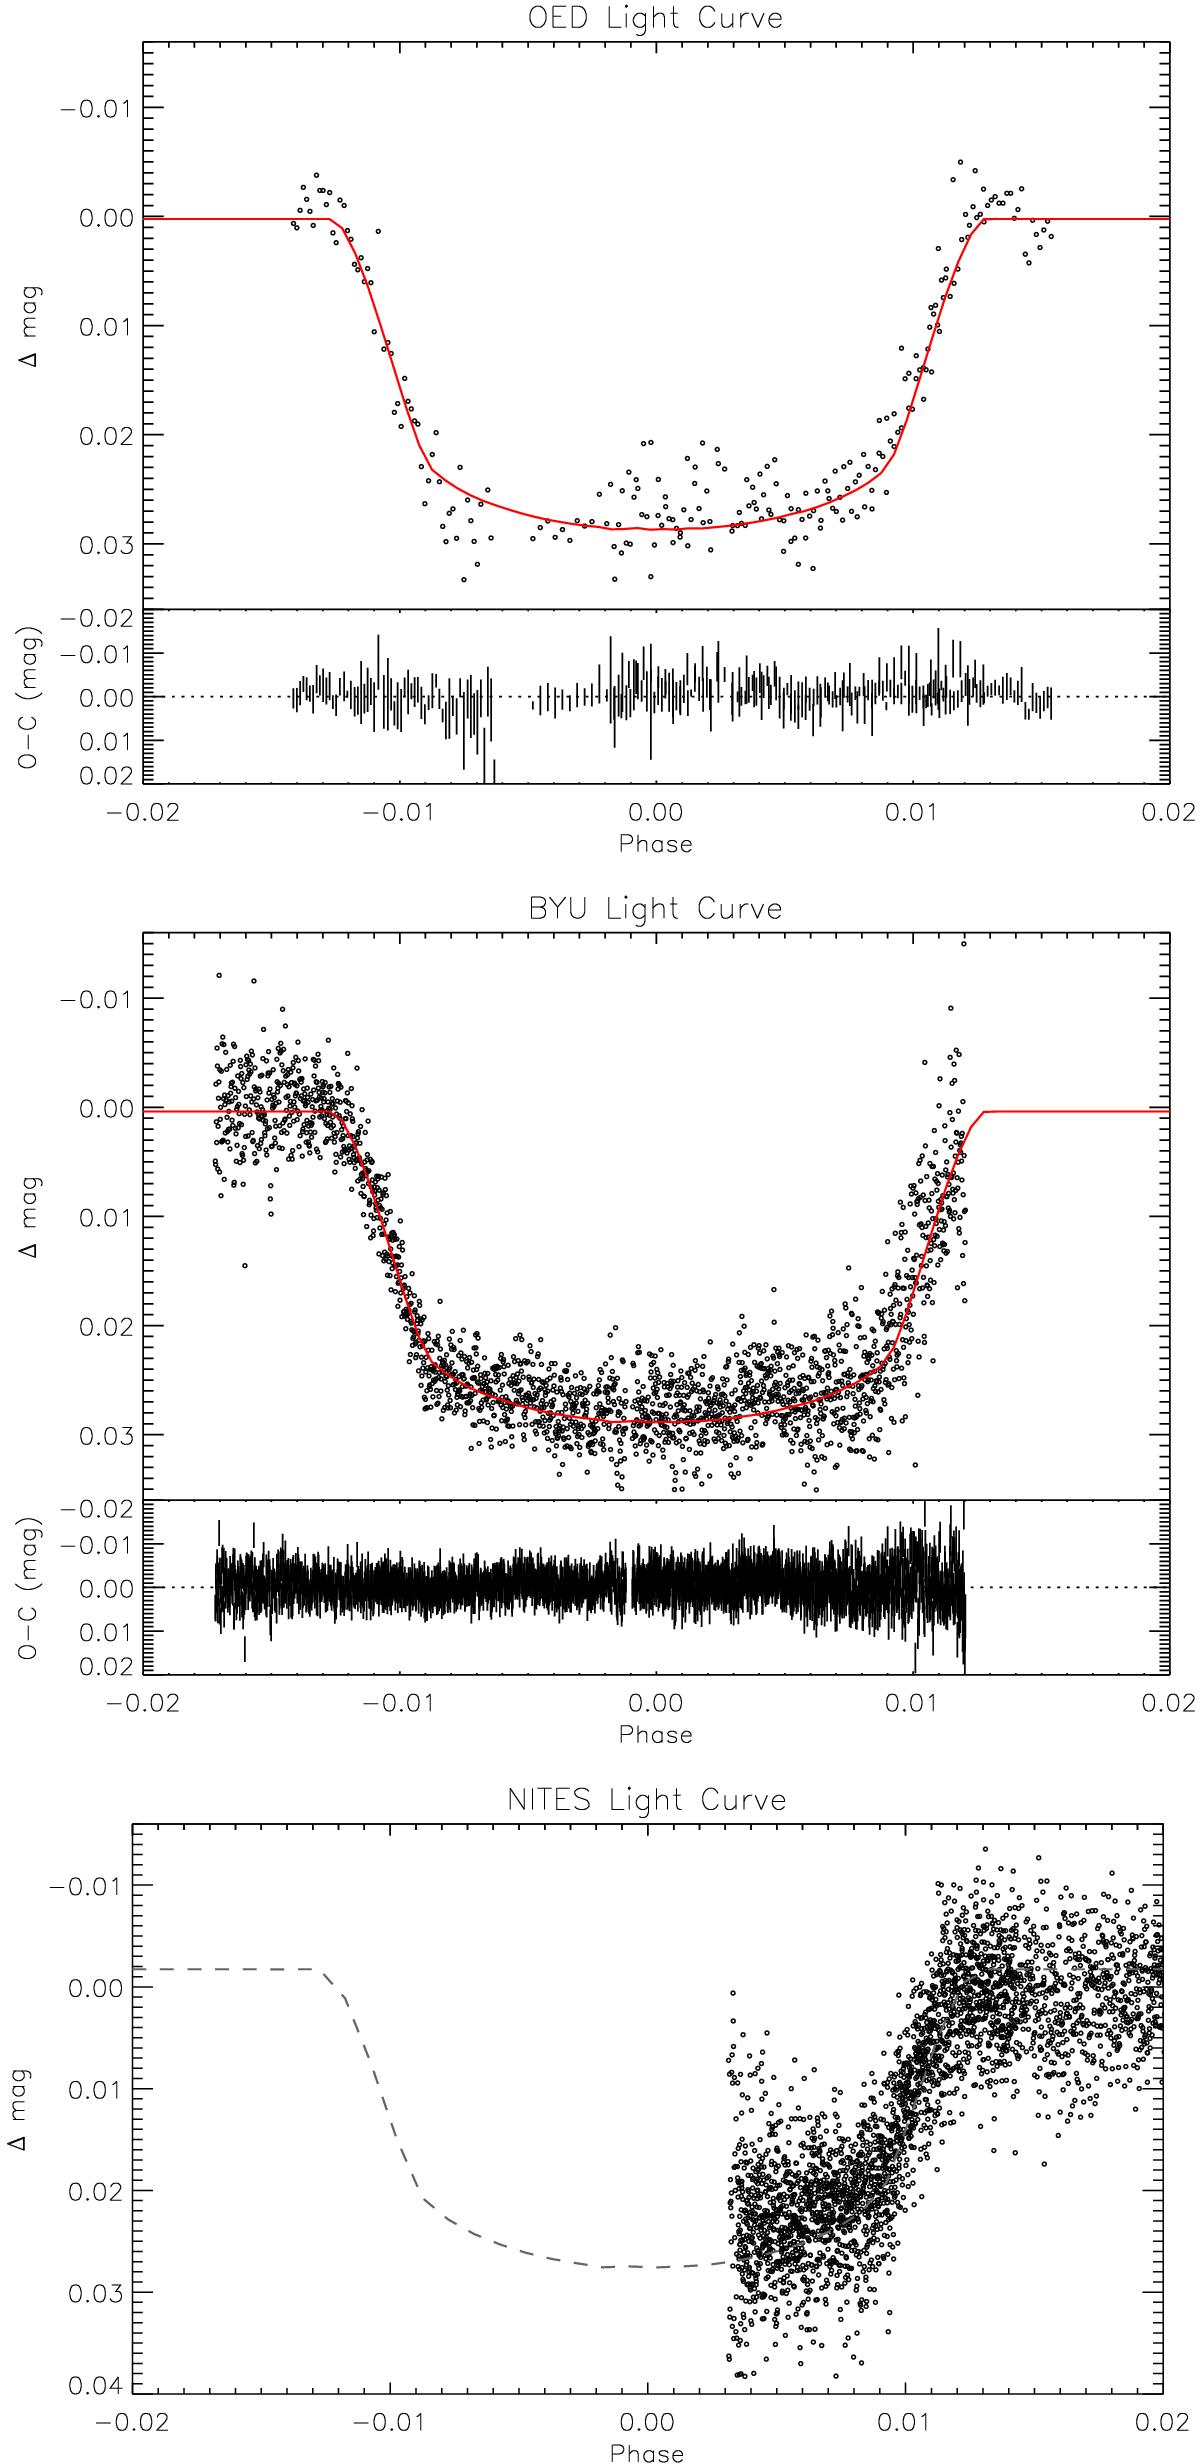
Follow-up photometry of the primary eclipse. On the top, we show the time series photometric points acquired at the OED (Sect. 2.3), phased to the ephemeris from Sect. 3.2, and overplotted with the best fit EB model described in Sect. 3.5 (red line). We also show directly below the residuals to the fit and the uncertainty of the individual photometric data points. Similarly in the middle panel, we show the data from BYU and the residuals to the fit. In the bottom panel, we show the partial primary eclipse data acquired with NITES. Overplotted in grey is a model light curve in the R-band, shown only for guidance and comparison to the upper panels. The NITES data were taken without a filter, and as such, we only utilise the NITES phtometry to derive the ephemeris, excluding it from the EB analysis (Sect. 3.5).
Current usage metrics show cumulative count of Article Views (full-text article views including HTML views, PDF and ePub downloads, according to the available data) and Abstracts Views on Vision4Press platform.
Data correspond to usage on the plateform after 2015. The current usage metrics is available 48-96 hours after online publication and is updated daily on week days.
Initial download of the metrics may take a while.