Fig. 9
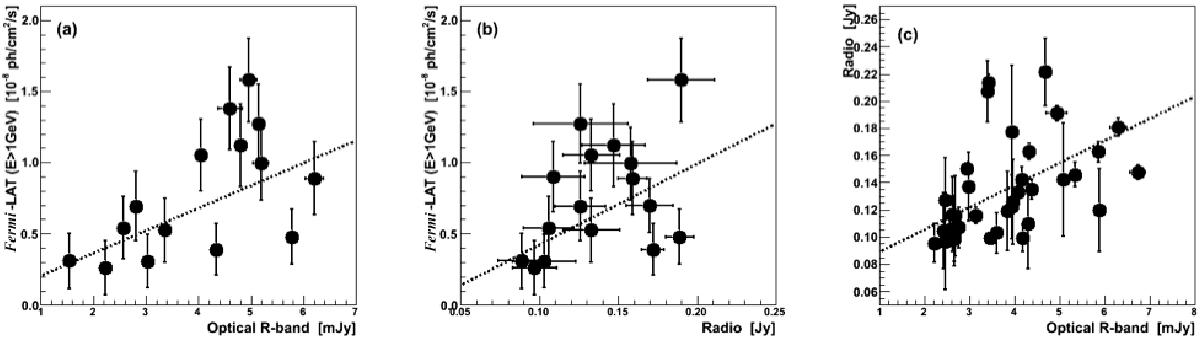
Flux-flux linear correlation plots for a time lag of zero for the long-term light curves reported in Fig. 4. a) One-month-averaged Fermi-LAT fluxes (E> 1 GeV) vs. one-month-averaged optical R-band fluxes. b) One-month-averaged Fermi-LAT fluxes (E> 1 GeV) vs. one-month-averaged radio 15 GHz fluxes. c) Radio 15 GHz fluxes vs. optical R-band fluxes. (Only single observations occurring during the same day were used.) The dotted line shows the best fit with a linear function.
Current usage metrics show cumulative count of Article Views (full-text article views including HTML views, PDF and ePub downloads, according to the available data) and Abstracts Views on Vision4Press platform.
Data correspond to usage on the plateform after 2015. The current usage metrics is available 48-96 hours after online publication and is updated daily on week days.
Initial download of the metrics may take a while.