Fig. 5
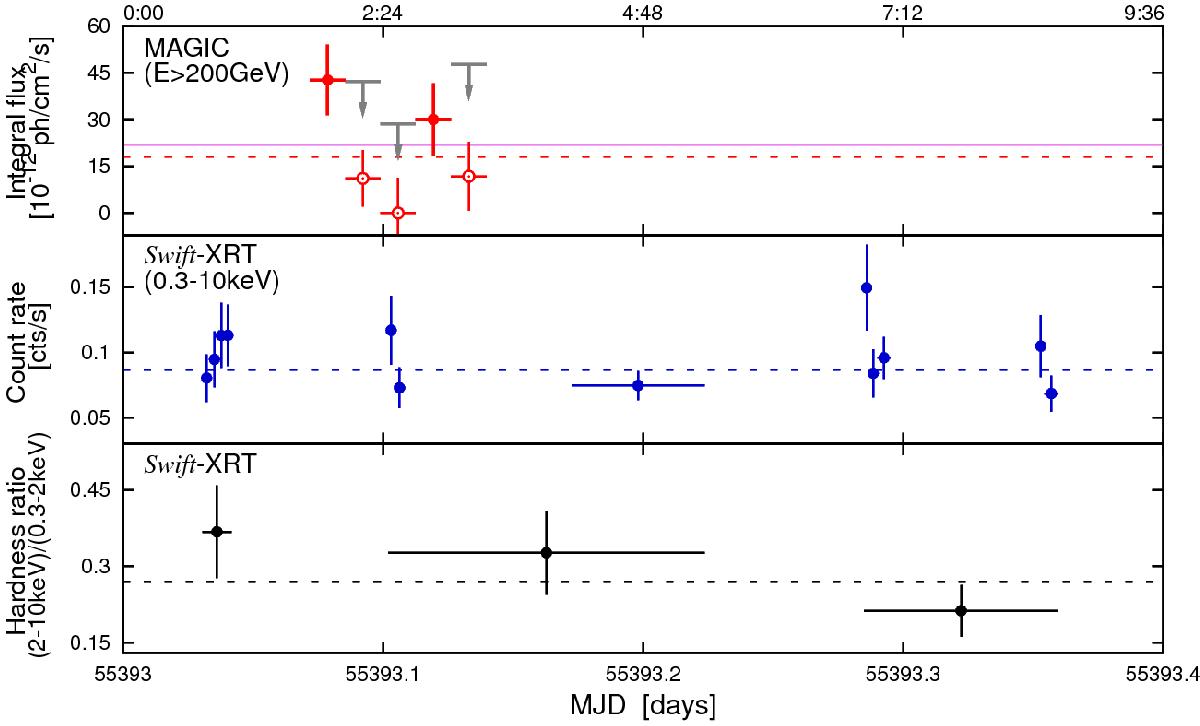
Intra-night multiband light curves of MAGIC J2001+439 observations on 2010 July 16. Top panel: VHE gamma-ray flux above 200 GeV, as measured by MAGIC. The open circles depict the fluxes with excess significances between 0 and 1.2σ (calculated according to Li & Ma 1983, Eq. (17)). The gray arrows report the 95% confidence level upper limits. The magenta solid line depicts 10% of the Crab Nebula flux, while the red dashed line reports the result of a fit with a constant function (χ2/nd.o.f. = 9.3/4). Middle panel: X-ray count rate in the energy range 0.3–10 keV, as measured by Swift XRT. The blue dashed line depicts the result of a fit with a constant function (χ2/nd.o.f. = 12.3/11). Bottom panel: hardness ratio (2–10 keV)/(0.3–2 keV). The black dashed line depicts the result of a fit with a constant function (χ2/nd.o.f. = 2.9/2). The X-ray count rate and hardness ratios were extracted from the automatic Swift XRT analysis for LAT sources6.
Current usage metrics show cumulative count of Article Views (full-text article views including HTML views, PDF and ePub downloads, according to the available data) and Abstracts Views on Vision4Press platform.
Data correspond to usage on the plateform after 2015. The current usage metrics is available 48-96 hours after online publication and is updated daily on week days.
Initial download of the metrics may take a while.