Fig. 4
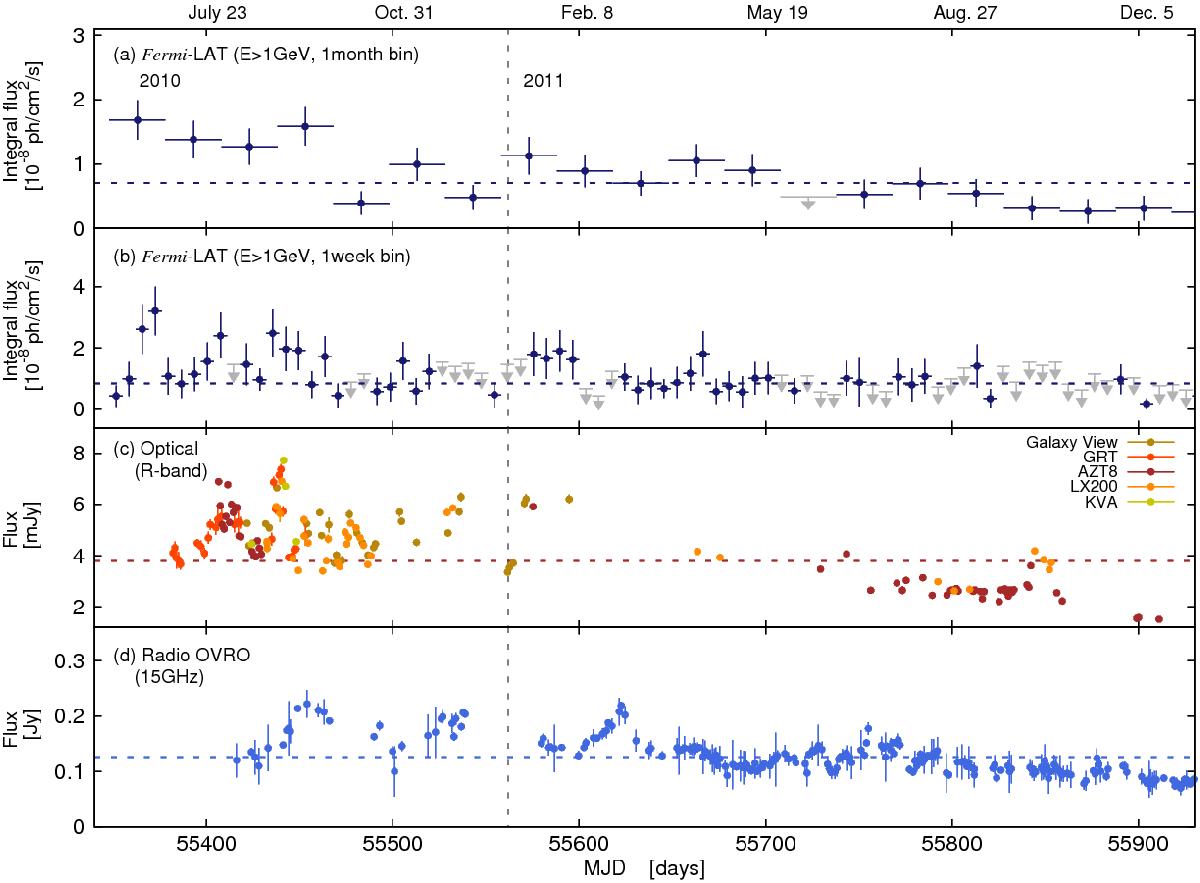
Long-term light curves of MAGIC J2001+439 in 2010 and 2011. a) Fermi-LAT light curve above 1 GeV with a monthly binning. b) Fermi-LAT light curve above 1 GeV with a weekly binning. The gray arrows report the flux upper limits at 95% confidence level, which were calculated for the time intervals with TS < 4. c) Optical R-band light curves. d) Radio light curve at 15 GHz. The horizontal dotted lines show the result of a fit with a constant function. See caption of Fig. 3 for further details.
Current usage metrics show cumulative count of Article Views (full-text article views including HTML views, PDF and ePub downloads, according to the available data) and Abstracts Views on Vision4Press platform.
Data correspond to usage on the plateform after 2015. The current usage metrics is available 48-96 hours after online publication and is updated daily on week days.
Initial download of the metrics may take a while.