Fig. 3
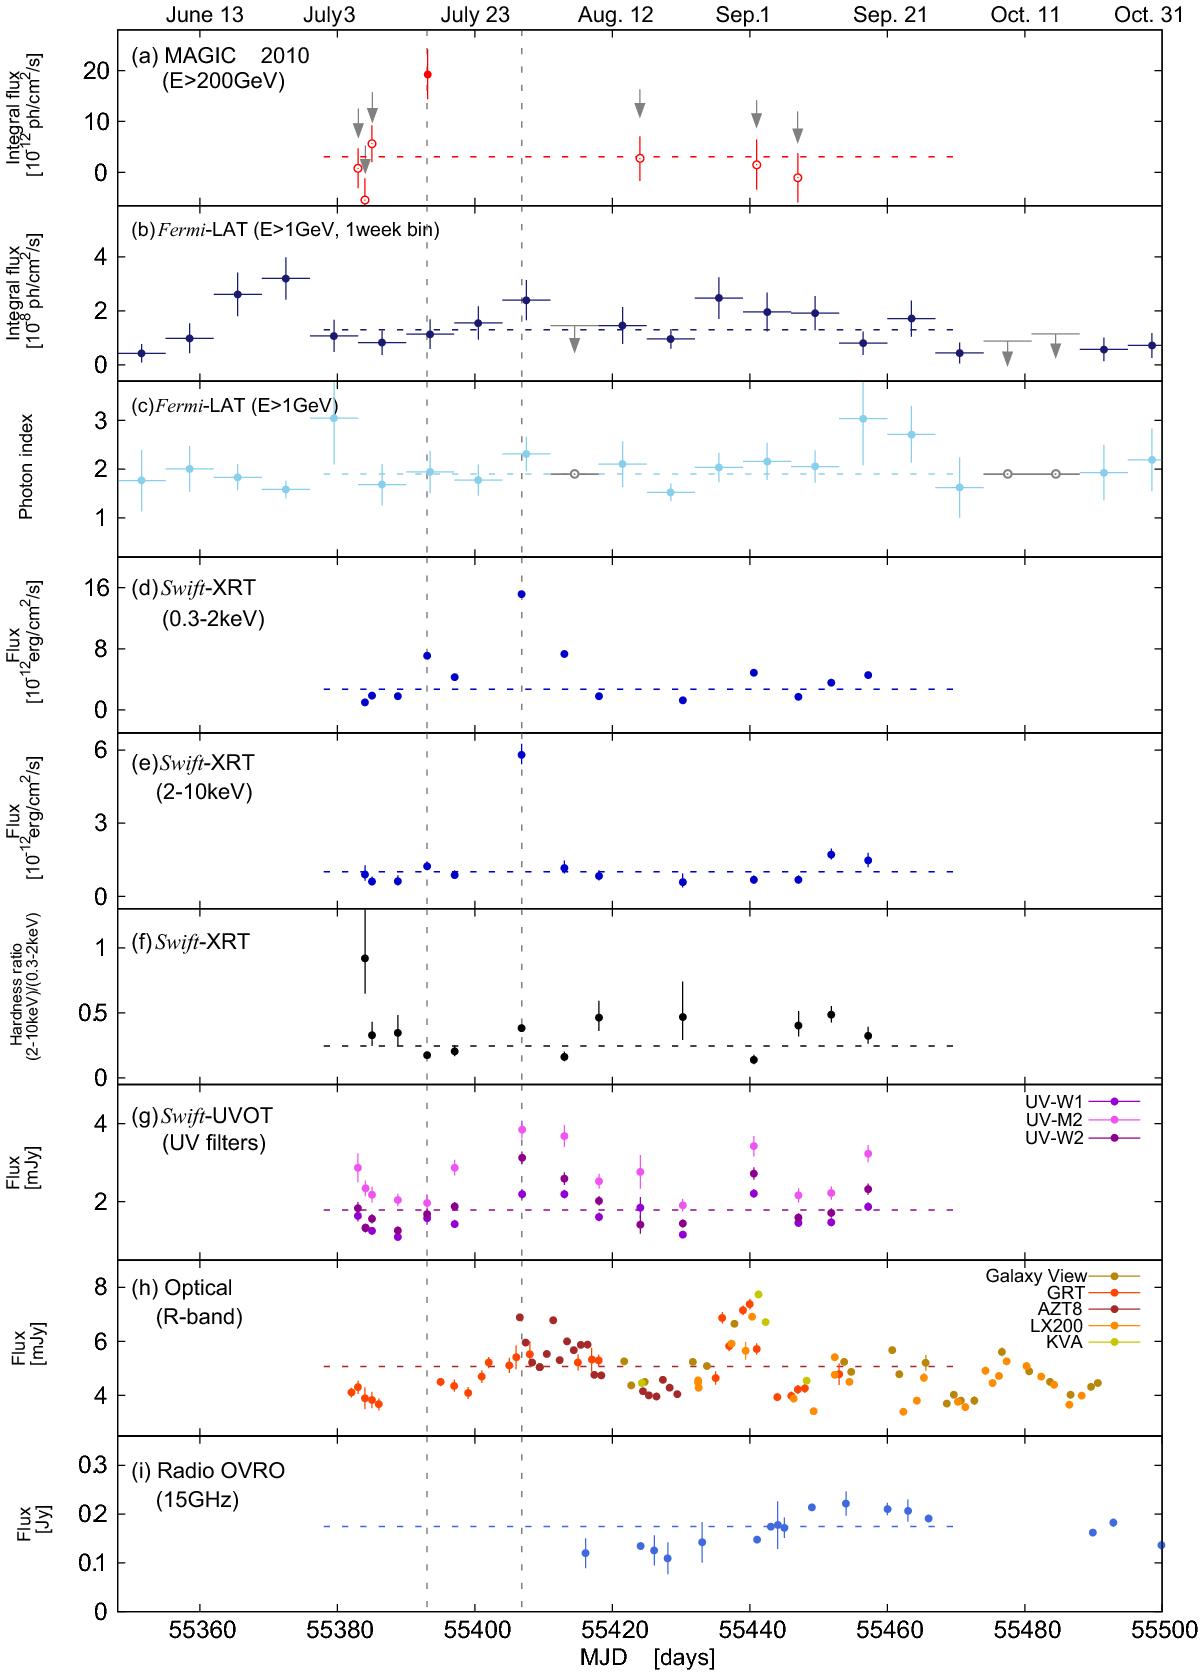
Multiband light curves of MAGIC J2001+439 during the observing campaign in 2010. All light curves show fluxes from single night observations, except for Fermi-LAT. a) MAGIC light curve above 200 GeV. The red filled circle depicts the flux during the VHE flare on 2010 July 16 (the only significant detection), while the open circles correspond to flux points with excess significances between −1.3 and 1.6σ (calculated according to Li & Ma 1983, Eq. (17)). The gray arrows report the 95% confidence level upper limits, calculated using a photon index of 2.8. b) Fermi-LAT light curve above 1 GeV with a weekly binning. The gray arrows report the flux upper limits at 95% confidence level, which were calculated (using the photon index of 1.9, reported for this source in the 2FGL catalog) for the time intervals with TS < 4. c) Fermi-LAT photon index computed with a weekly binning. The gray open circles denote the assumed photon index for the calculation of the upper limits. d) Swift-XRT light curve in the energy range from 0.3 to 2 keV. e) Swift-XRT light curve in the energy range from 2 to 10 keV. f) Hardness ratio (2–10 keV)/(0.3–2 keV). g) Swift-UVOT light curves for the three UV filters. h) Optical R-band light curves from different telescopes (see legend). i) Radio light curve at 15 GHz from the OVRO telescope. The horizontal dotted lines show the result of a fit with a constant function (the UV-W2 flux points were used for the Swift-UVOT light curve). The first and second gray vertical dashed lines denote July 16 and July 29 respectively.
Current usage metrics show cumulative count of Article Views (full-text article views including HTML views, PDF and ePub downloads, according to the available data) and Abstracts Views on Vision4Press platform.
Data correspond to usage on the plateform after 2015. The current usage metrics is available 48-96 hours after online publication and is updated daily on week days.
Initial download of the metrics may take a while.