Fig. 13
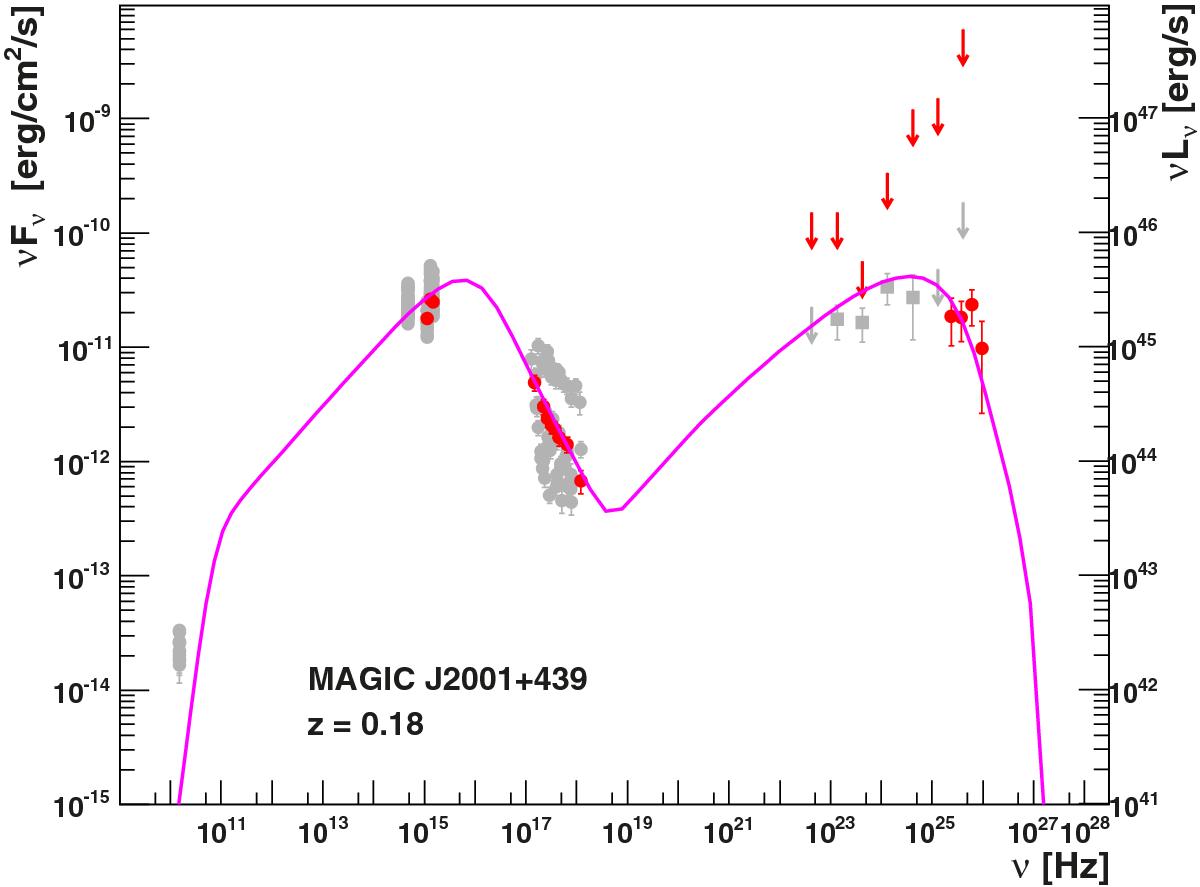
Broadband SED for 2010 July 16. The simultaneous data are depicted with red filled circles (which involve observations from MAGIC, Fermi-LAT, Swift-XRT, and Swift-UVOT). The gamma-ray data points were corrected for attenuation on the EBL using a redshift z = 0.18 and the model from Franceschini et al. (2008). The red arrows show the 95% upper limits for a one-day-averaged Fermi-LAT spectrum (MJD: 55 392.5–55 393.5), which is coincident with the MAGIC VHE observation from July 16. The gray filled squares represent the one-month-averaged Fermi-LAT spectrum in 2010 July (MJD: 55 378–55 409), and the gray filled circles show all the radio/optical/UV/X-ray data taken during the MWL campaign in 2010, excluding July 16. The magenta solid curve represents the resulting intrinsic spectrum parameterized with a one-zone SSC model. See text for further details.
Current usage metrics show cumulative count of Article Views (full-text article views including HTML views, PDF and ePub downloads, according to the available data) and Abstracts Views on Vision4Press platform.
Data correspond to usage on the plateform after 2015. The current usage metrics is available 48-96 hours after online publication and is updated daily on week days.
Initial download of the metrics may take a while.