Fig. 1
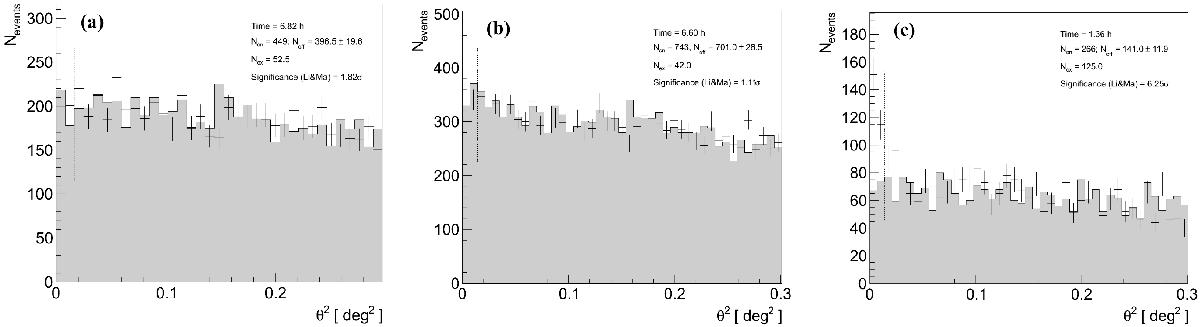
Theta-squared distributions of MAGIC J2001+439 observed on 2009 November (panel a), energy threshold is E> 100 GeV) between July and September excluding 2010 July 16 (panel b), E> 70 GeV) and on 2010 July 16 (panel c), E> 70 GeV). Crosses represent the event distribution from the source, while the gray histogram the measured background. The signal region is indicated by the vertical dotted line.
Current usage metrics show cumulative count of Article Views (full-text article views including HTML views, PDF and ePub downloads, according to the available data) and Abstracts Views on Vision4Press platform.
Data correspond to usage on the plateform after 2015. The current usage metrics is available 48-96 hours after online publication and is updated daily on week days.
Initial download of the metrics may take a while.